Jordan Obey

Yael Goldstein

Kevin Abraham
Editor’s note: This post covers Cloud Network Monitoring, a Datadog feature that was originally called Network Performance Monitoring.
Whether running on a fully cloud-hosted environment, on-premise servers, or a hybrid solution, modern services and applications are heavily reliant on network and DNS performance. This makes comprehensive visibility into your network a key part of monitoring application health and performance. But as your applications grow in scale and complexity, gaining this visibility is challenging.
To help identify and troubleshoot problems before they affect your application and users, Datadog Cloud Network Monitoring (CNM) enables you to visualize and break down data flow across your network. By giving you visibility into network traffic flows, CNM enables you to quickly spot issues that manifest as traffic spikes, drops, or latency between different endpoints in your environment.
Once you’ve set up CNM, Datadog automatically collects key transport-layer (TCP/UDP) and DNS data related to traffic between each endpoint in your environment, including VMs, containers, services, cloud regions or datacenters, and much more.
In this post, we’ll show you how you can use Datadog to monitor the health and performance of your network dependencies. In particular, we’ll cover how to:
- Use our out-of-the-box CNM dashboard to view key network metrics for insight into the health and performance of your network
- Quickly monitor critical dependencies with Saved Views
- Pinpoint root causes with correlated network, application, and infrastructure telemetry data with telemetry from other layers of your stack
View key network metrics with the CNM Overview dashboard
As you scale your applications and services, they need to reliably communicate over larger and more complex networks. Without visibility into each aspect of network communication, it can be difficult to determine which is the source of an issue and needs troubleshooting. For instance, monitoring network throughput can help determine whether excessive traffic is overloading your systems and the culprit behind a problem. Similarly, tracking TCP connection metrics and DNS server errors over time helps assess network health since either can negatively impact network communication.
Datadog automatically collects key network traffic and DNS server metrics and populates an out-of-the-box CNM Overview dashboard that provides a unified, high-level view of key network health and performance across different facets of your distributed network. This helps you get up and running on CNM quickly to immediately locate problems and drill down to investigate. You can read more about the CNM Overview dashboard in this notebook.
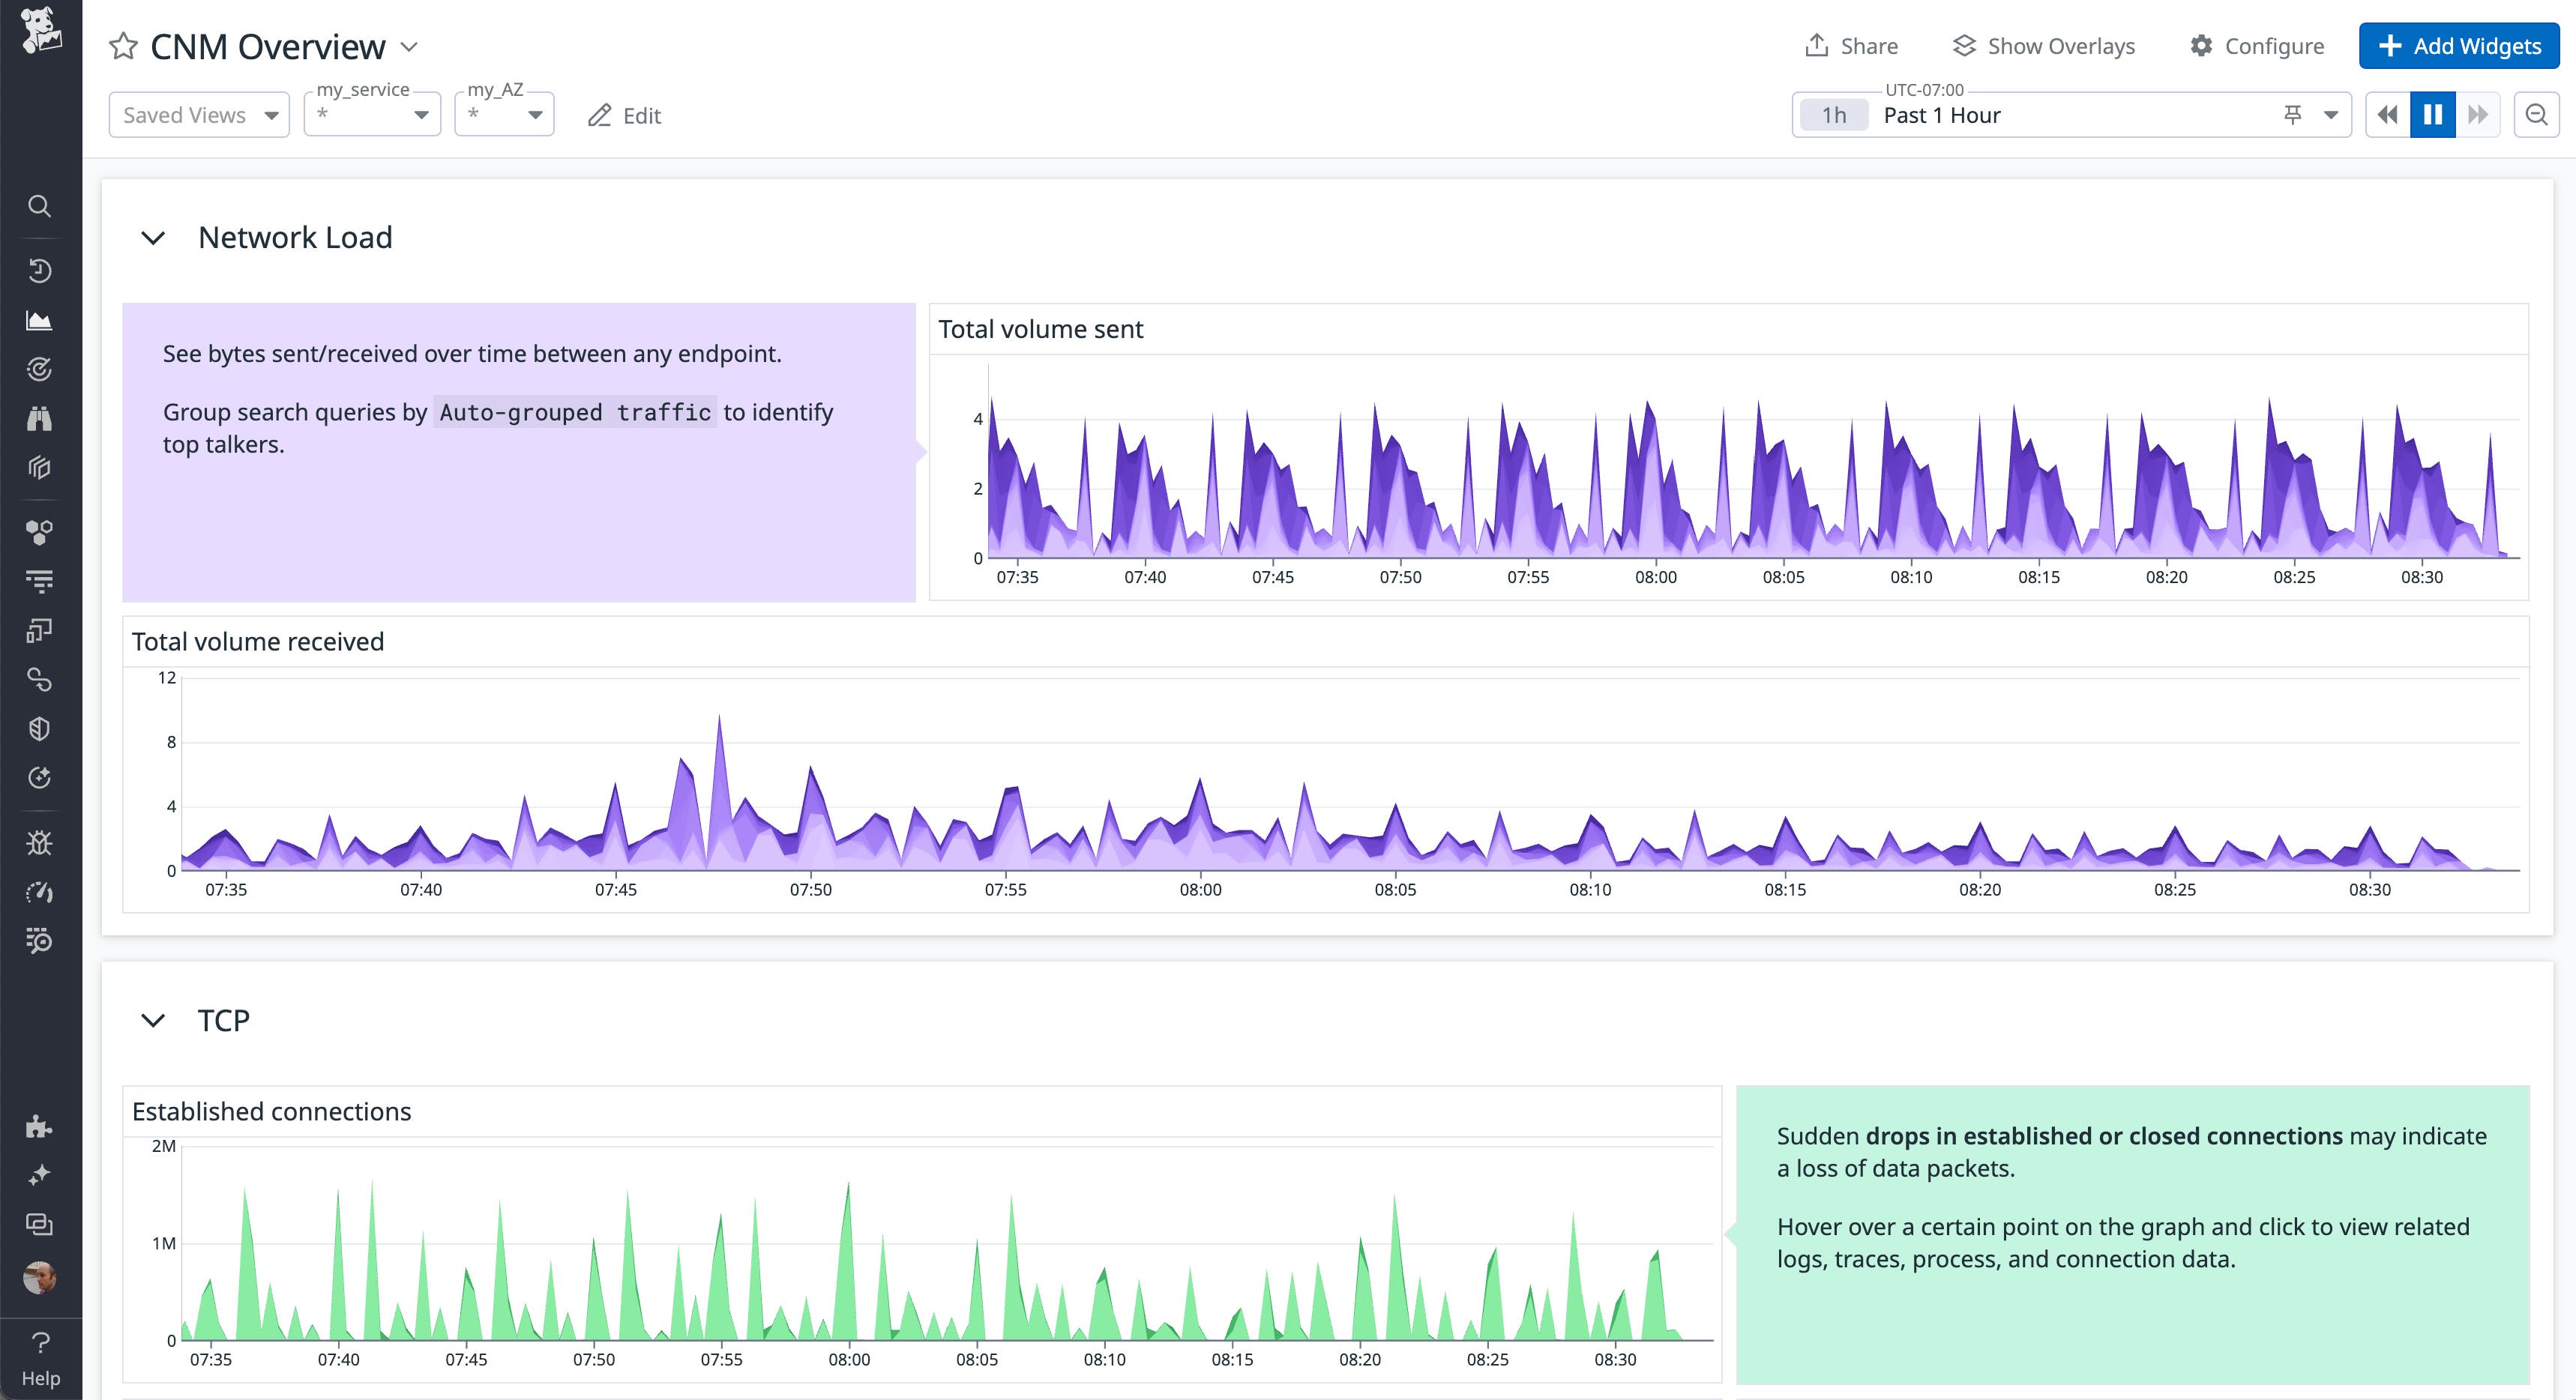
The CNM Overview dashboard organizes network metrics into the following essential categories to make it easier to troubleshoot problems within different layers of network performance and correlate that data with other telemetry from your environment:
- Network load
- TCP traffic performance
- DNS health
- Application overview
- Cross-regional traffic overview
Network load metrics
The Network Load section visualizes the volume of bytes sent and received between tagged network endpoints (e.g., services and availability zones). Data sent and received are fundamental network metrics because they provide you with an overall view of network traffic and can clue you into sudden data flow stoppages or spikes and which parts of your infrastructure are being affected. If an endpoint is hit with far more traffic than usual, its underlying hosts or containers can become overloaded and start overconsuming resources, leading to higher latencies or outages. Alternatively, if you spot services or infrastructure components that are not sending or receiving any data, you know where to focus your troubleshooting efforts.
TCP metrics
Most network communication is facilitated by the Transmission Control Protocol (TCP). In order for a client and server to send data packets to each other successfully, they first need to establish a TCP connection. Problems establishing and maintaining these connections can mean that services are unable to communicate with each other. Visibility into TCP metrics can help you identify and mitigate connectivity issues.
The TCP section of the CNM Overview dashboard visualizes key TCP metrics like the number of established and closed connections, as well as retransmits, so you can pinpoint sources of latency and outages. For example, if you spot a sudden spike in TCP retransmits from a particular service to a destination endpoint alongside a drop in established connections, it could be a sign of a networking issue that needs further investigation&endash;such as traffic congestion, a network misconfiguration, or faulty hardware.

DNS metrics
The Domain Name System (DNS) is responsible for mapping domain names to their corresponding IP addresses. DNS issues can lead to services and devices being unable to find or connect to endpoints they rely on, which can prevent users from accessing your web applications. DNS communication consists of a client requesting the IP address of a domain name from one or more DNS servers. Since an issue can occur at either end, monitoring key DNS metrics can help you distinguish between client-side issues, like misconfigured requests, and server-side issues, like resource saturation (i.e., overwhelmed by client requests) affecting your DNS servers.
You can use tags to slice and dice the CNM Overview dashboard to quickly look for client- or server-side DNS issues. For example, group DNS metrics by either app or service tags to view the DNS performance of your client applications and services. Then, to look for server-side issues, we recommend grouping by either dns_server or cluster. By visualizing metrics like DNS requests, failures, and timeouts across regions, you can quickly spot issues that you need to dive into.
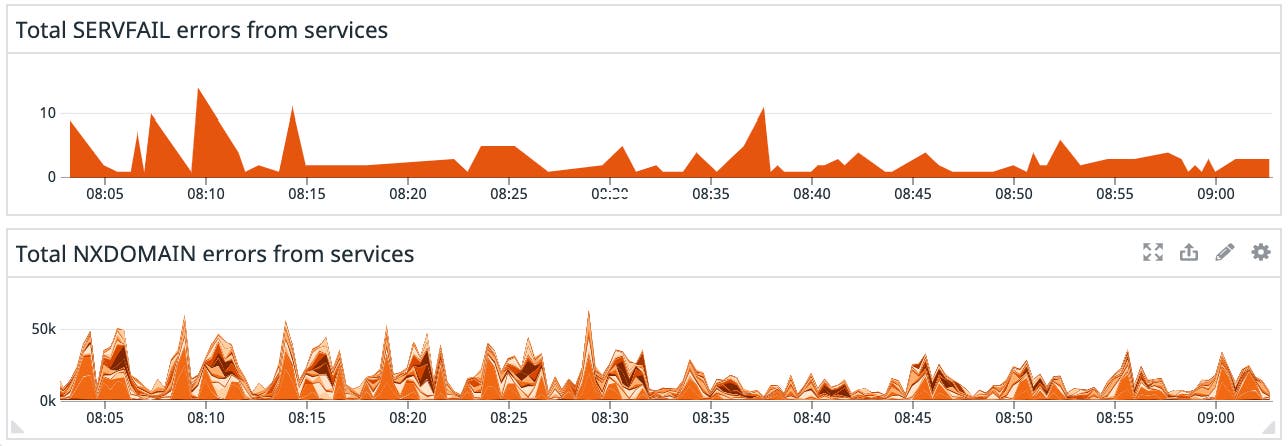
DNS response codes are another reliable bellwether for DNS health and performance. Two common response errors to look for are SERVFAIL errors, which point to server issues, and NXDOMAIN errors, which mean clients are making requests to nonexistent domains (likely because of a misconfiguration). The CNM Overview dashboard visualizes what percentage these errors make up of all responses, making it easy to identify spikes or worrisome trends that require investigation.
Application overview metrics
Since modern applications are highly distributed and vulnerable to networking issues, being able to correlate network and application-level monitoring data is critical for identifying the root cause of issues. For example, customizing the CNM Overview dashboard’s Application Overview section to visualize network throughput next to application performance data such as service latency that’s available through Datadog APM can help you spot signs that a network issue (e.g., an unexpected drop in bytes sent from a particular service) has negatively impacted application performance (e.g., a spike in latency). You can also correlate network metrics with third-party endpoint health metrics, such as Elastic Load Balancer (ELB) 5xx errors to determine if there is a service-level issue.
Cross-regional traffic metrics
In order for your cloud-hosted services to be highly available and perform well, it’s often necessary to utilize multiple availability zones and regions. However, when data flows across regions and availability zones, it can drive up costs and create more network vulnerabilities. While some traffic between regions or availability zones might be expected, you should look out for unexpected spikes in interregional traffic. The CNM Overview dashboard’s Cloud Region Overview section enables you to view key metrics covered earlier in this post in the context of cross-regional and cross-AZ communication. For instance, you can view the volume of network traffic between availability zones to reveal where you can reconfigure your network to reduce costs. This section also includes a “Top cross-AZ talkers” widget, which identifies source endpoints that send most traffic across availability zones. This means you can quickly spot the source of the spike network communication inefficiencies and begin mitigating the issue.
Quickly monitor critical dependencies with Saved Views
Datadog’s Network page enables you to use queries to scope your view to the performance of communication between specific services, pods, cloud resources, and more. When monitoring distributed architectures, you often need to switch your focus between different aspects of network communication to effectively identify issues. For instance, you may be regularly moving back and forth between viewing network traffic between services to network traffic between their underlying pods. Because these are common views to reference when monitoring network performance, writing queries each time means you may lose valuable time needed to troubleshoot. You can use preset Saved Views to quickly access useful default and custom queries in the Network view, which enables you to immediately view monitoring data in the scope of your troubleshooting context. For example, the “traffic to external domains” Saved View groups traffic by the service and domain tags so you can see network performance metrics related to traffic between a service and an external domain endpoint.

Datadog also provides a built-in “cross-availability zone traffic” Saved View, which groups data by the availability-zone tag so you can view traffic that occurs across availability zones which, as we mentioned, can drive up costs and may increase network latency.

Saved Views provide you with quick access to relevant network flow data so you can access the information you need and troubleshoot faster.
Correlate network data with telemetry from each layer of your stack
Because applications rely heavily on each other, poor connectivity or slow calls may manifest as errors and latency at the application layer. For example, service latency can be the result of a code-level bug, or it could be an issue with an upstream or downstream service. If, however, you only have visibility into either your network layer or your application layer, it can be challenging to determine which is behind an issue and what team to alert so they can start troubleshooting.
Datadog CNM automatically ties together monitoring data from each layer of your stack so you can correlate them easily. For example, if you see that an availability zone has unexpectedly high TCP retransmits in the Network view, without leaving that view you can open a side panel to explore all correlated logs, traces, and processes for additional context that helps identify the problem. In the screenshot below, we have sorted processes by CPU utilization to show that no single process has saturated CPU resources in that availability zone, and the cause of the increased TCP retransmits may lie elsewhere.
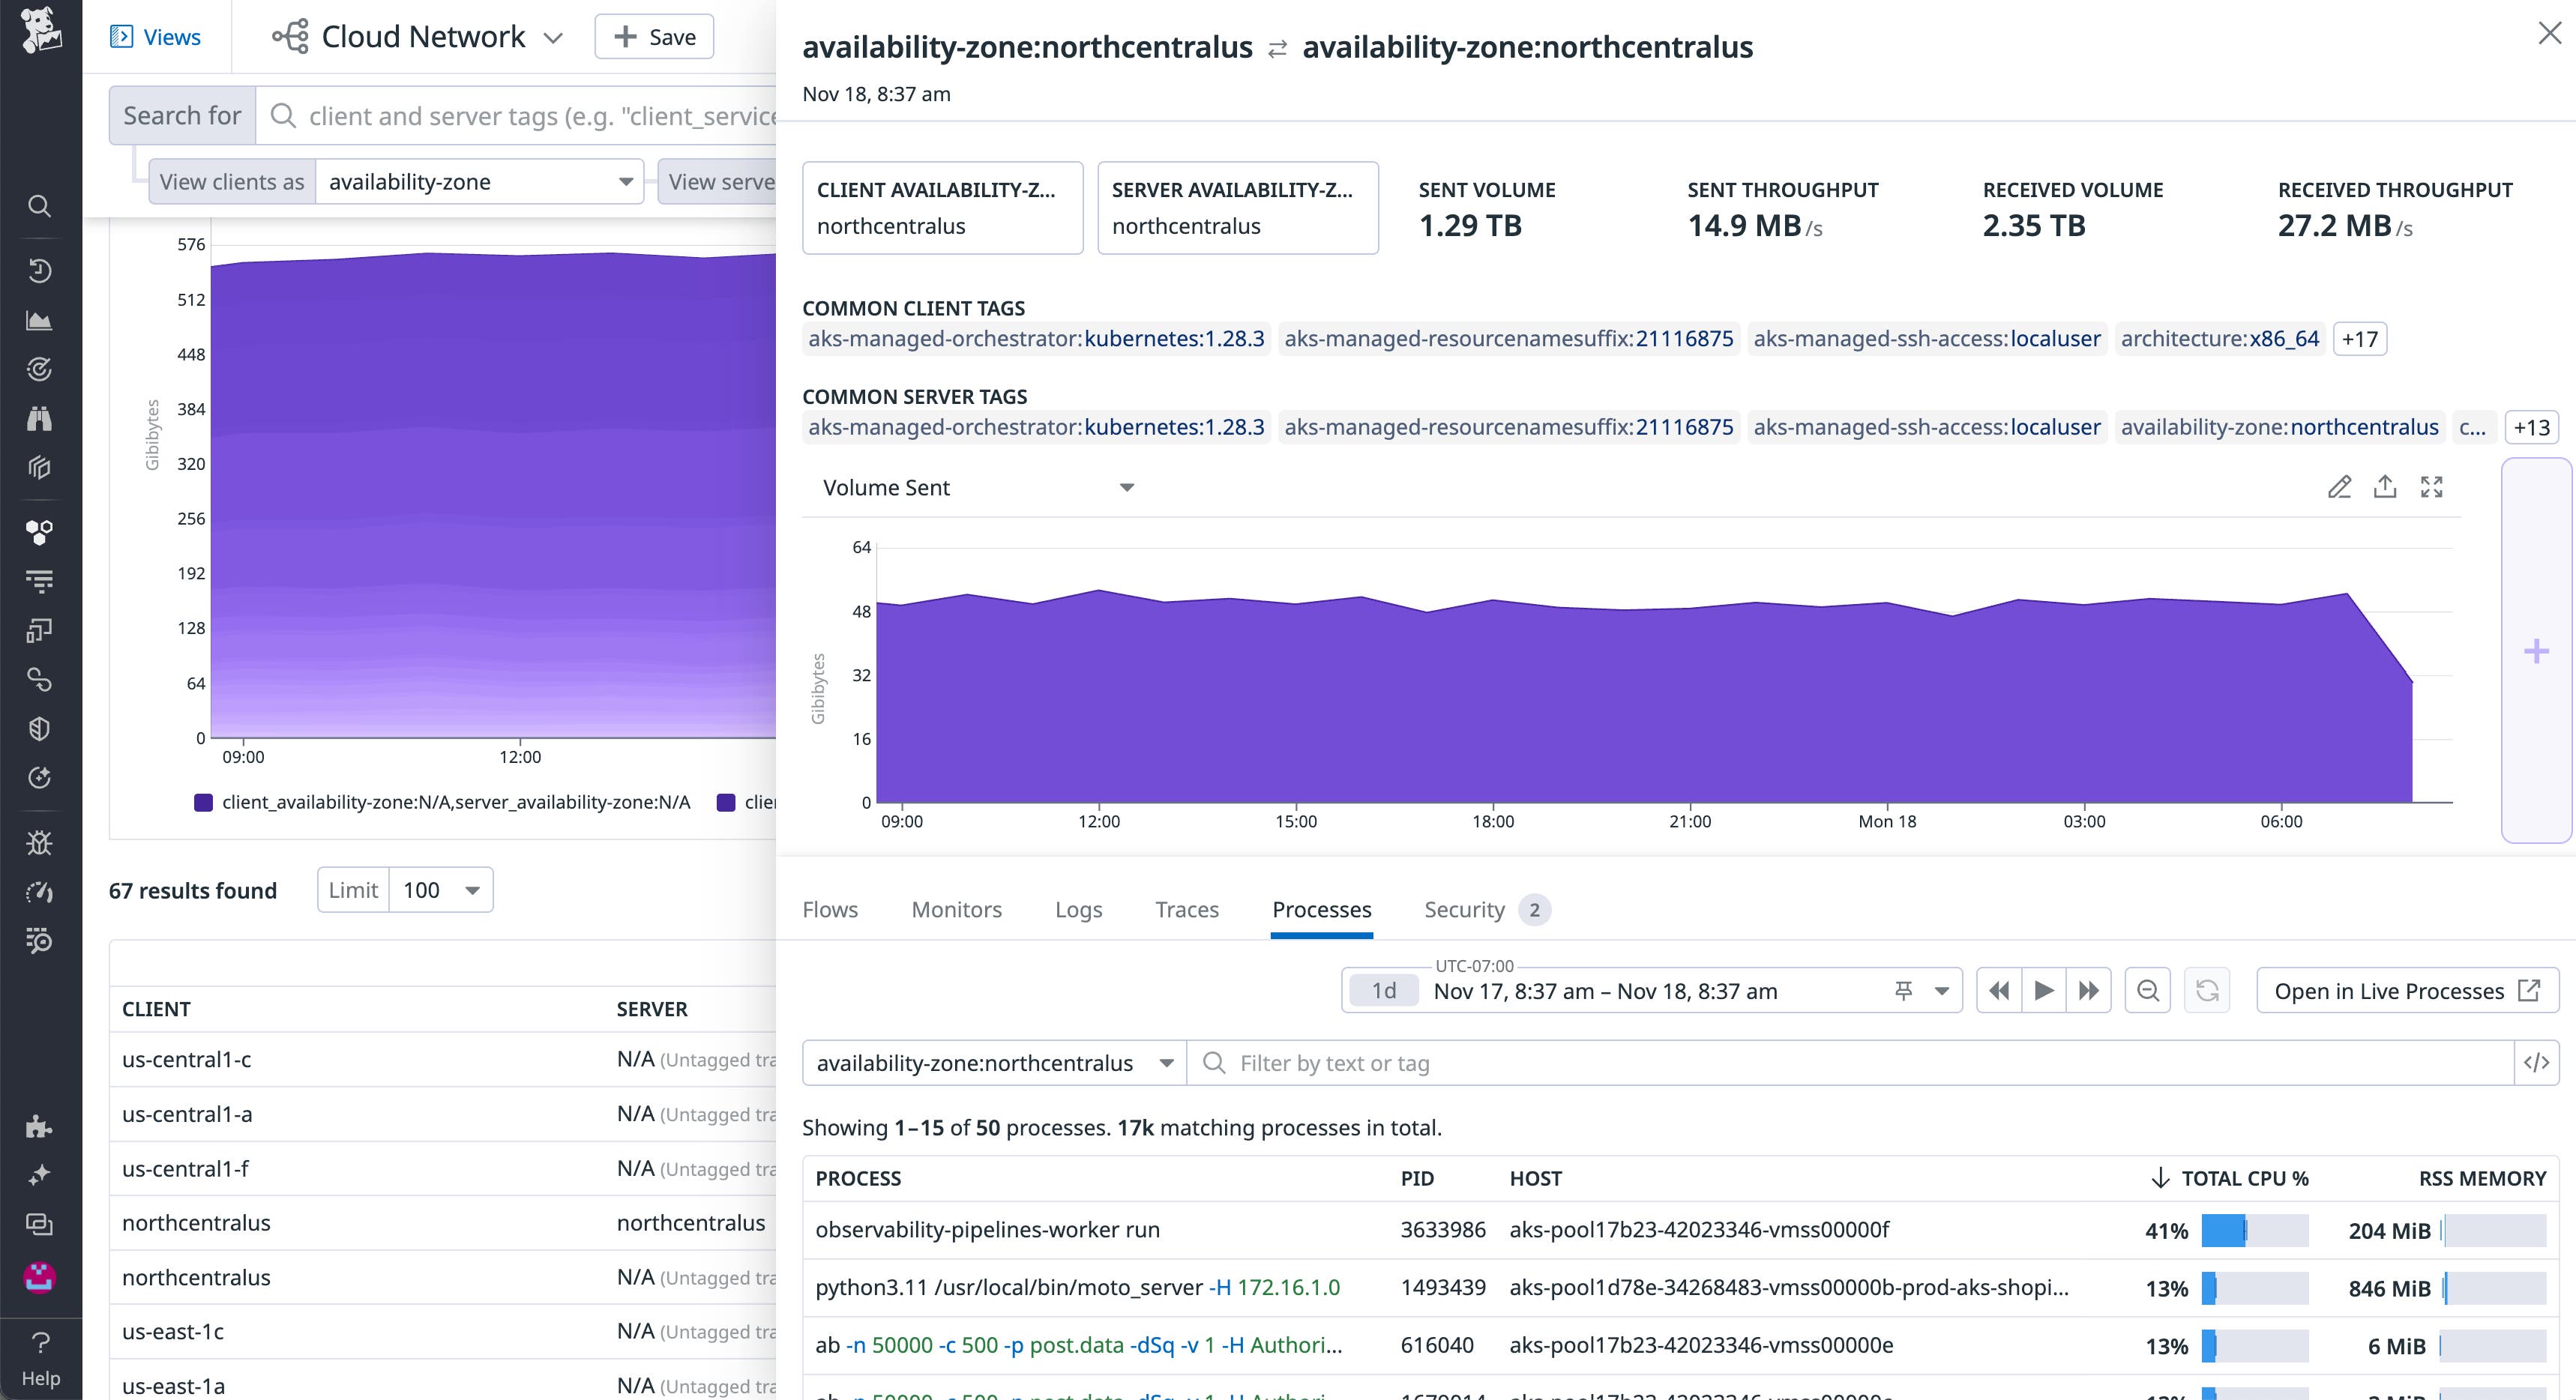
Network data is just one piece of the puzzle. By automatically correlating network data with telemetry from the rest of your stack, you can gain a deeper understanding of the health of your environment, enabling you to effectively pinpoint the origins of an issue.
Get started with Cloud Network Monitoring today
Datadog Cloud Network Monitoring helps make troubleshooting problems with your network easier by visualizing key performance metrics, and providing preset Saved Views that let you quickly scope to relevant troubleshooting data. Additionally, Datadog CNM automatically ties network traffic to other key metrics, traces, logs, and processes to help uncover root causes. Datadog CNM uses an eBPF-powered system probe for Linux and a custom driver for Windows hosts so you can get network-level visibility with minimal overhead regardless of your operating system.
If you’re already a Datadog customer, see the documentation to get started using Cloud Network Monitoring. Otherwise, sign up for a 14-day free trial.


