Aaron Weber

Evan Pandya
In modern application development, changes happen constantly: Deployments are pushed, feature flags are toggled, and Kubernetes events reshape infrastructure, to name just a few. While these practices drive innovation and scalability, they also introduce complexity---especially during incidents. Fragmented tools and workflows across teams and organizations make it difficult to pinpoint the root causes of issues, leading to longer resolution times.
To address these challenges, Datadog Change Tracking offers real-time visibility into a wide array of system changes by surfacing relevant changes directly within Datadog’s monitors, dashboards, and service pages. Change Tracking provides an immediate and unified view of changes such as application deployments, feature toggle updates, Kubernetes events, and database modifications. Teams can promptly identify relevant changes and take informed action, accelerating root cause analysis and reducing time to resolution.
In this post, we’ll walk you through an example of how Change Tracking can help you:
- View changes to your services and dependencies directly in context
- Correlate recent changes with shifts in health and performance metrics
- Analyze detailed change insights and take next steps, all within the Datadog platform
View changes to your services and dependencies directly in context
Imagine that you receive an alert that the error rate for a critical API is spiking. Your team’s first step is to investigate potential root causes. Without a unified view of changes, the investigation process is fragmented. Your team must manually gather data from various logs, monitoring tools, and pipelines to try to understand what might have changed. This manual work delays incident resolution and increases the risk of focusing on the wrong area.
With Change Tracking, changes made to the API and its dependencies are immediately accessible in context across the Datadog platform, including on:
- Monitor status pages: When a monitor is in a warning or alerting state, use Change Tracking to review recent changes related to the affected service directly on the status page. This functionality helps you quickly identify if a recent deployment, feature flag, or other change might have contributed to the monitor’s change in state.
- Service pages: On the Service Summary page in APM, view the timeline of changes to the service and its dependencies alongside metrics such as latency, error rate, and throughput. This functionality helps you see how recent updates align with fluctuations in performance or health metrics.
- Dashboards: Use the Show Overlays button to display tracked changes as interactive overlays directly on timeseries widgets or directly in the change timeline for clear visual correlation between changes and metric trends.
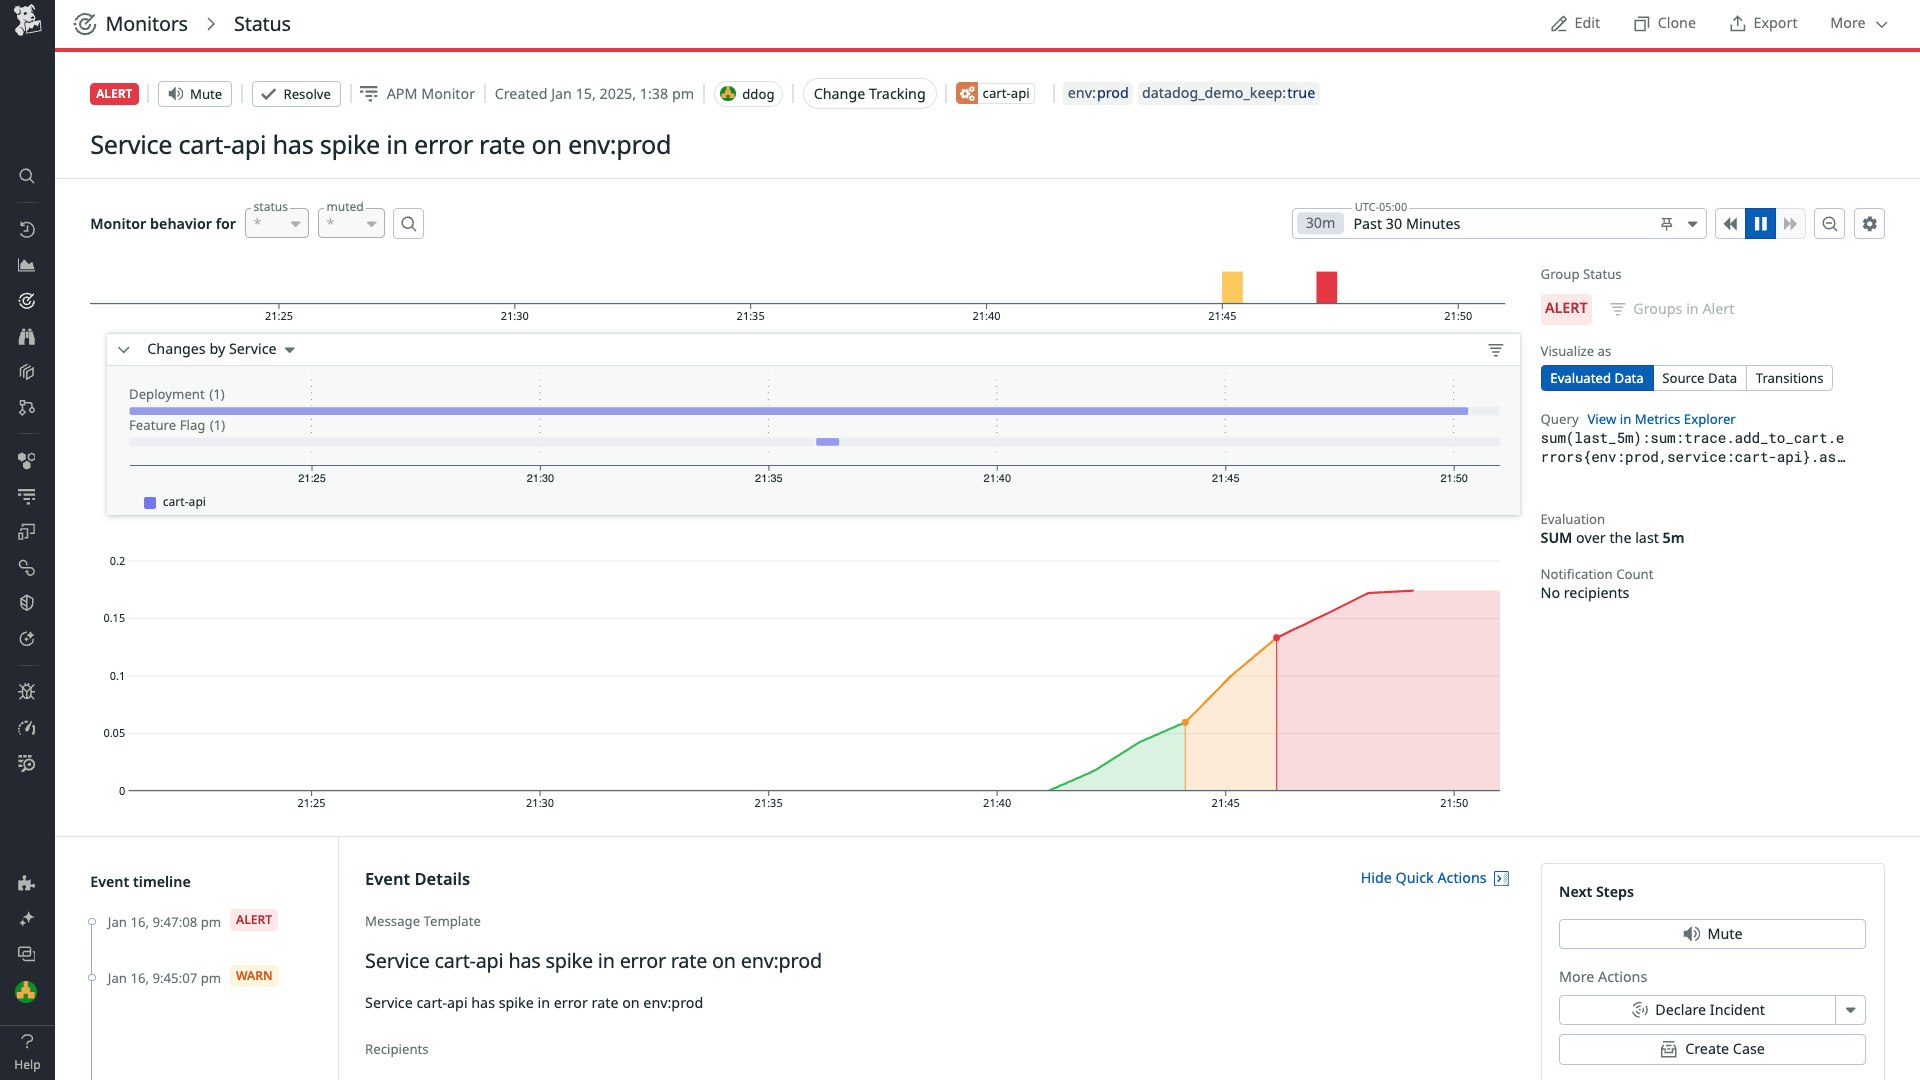
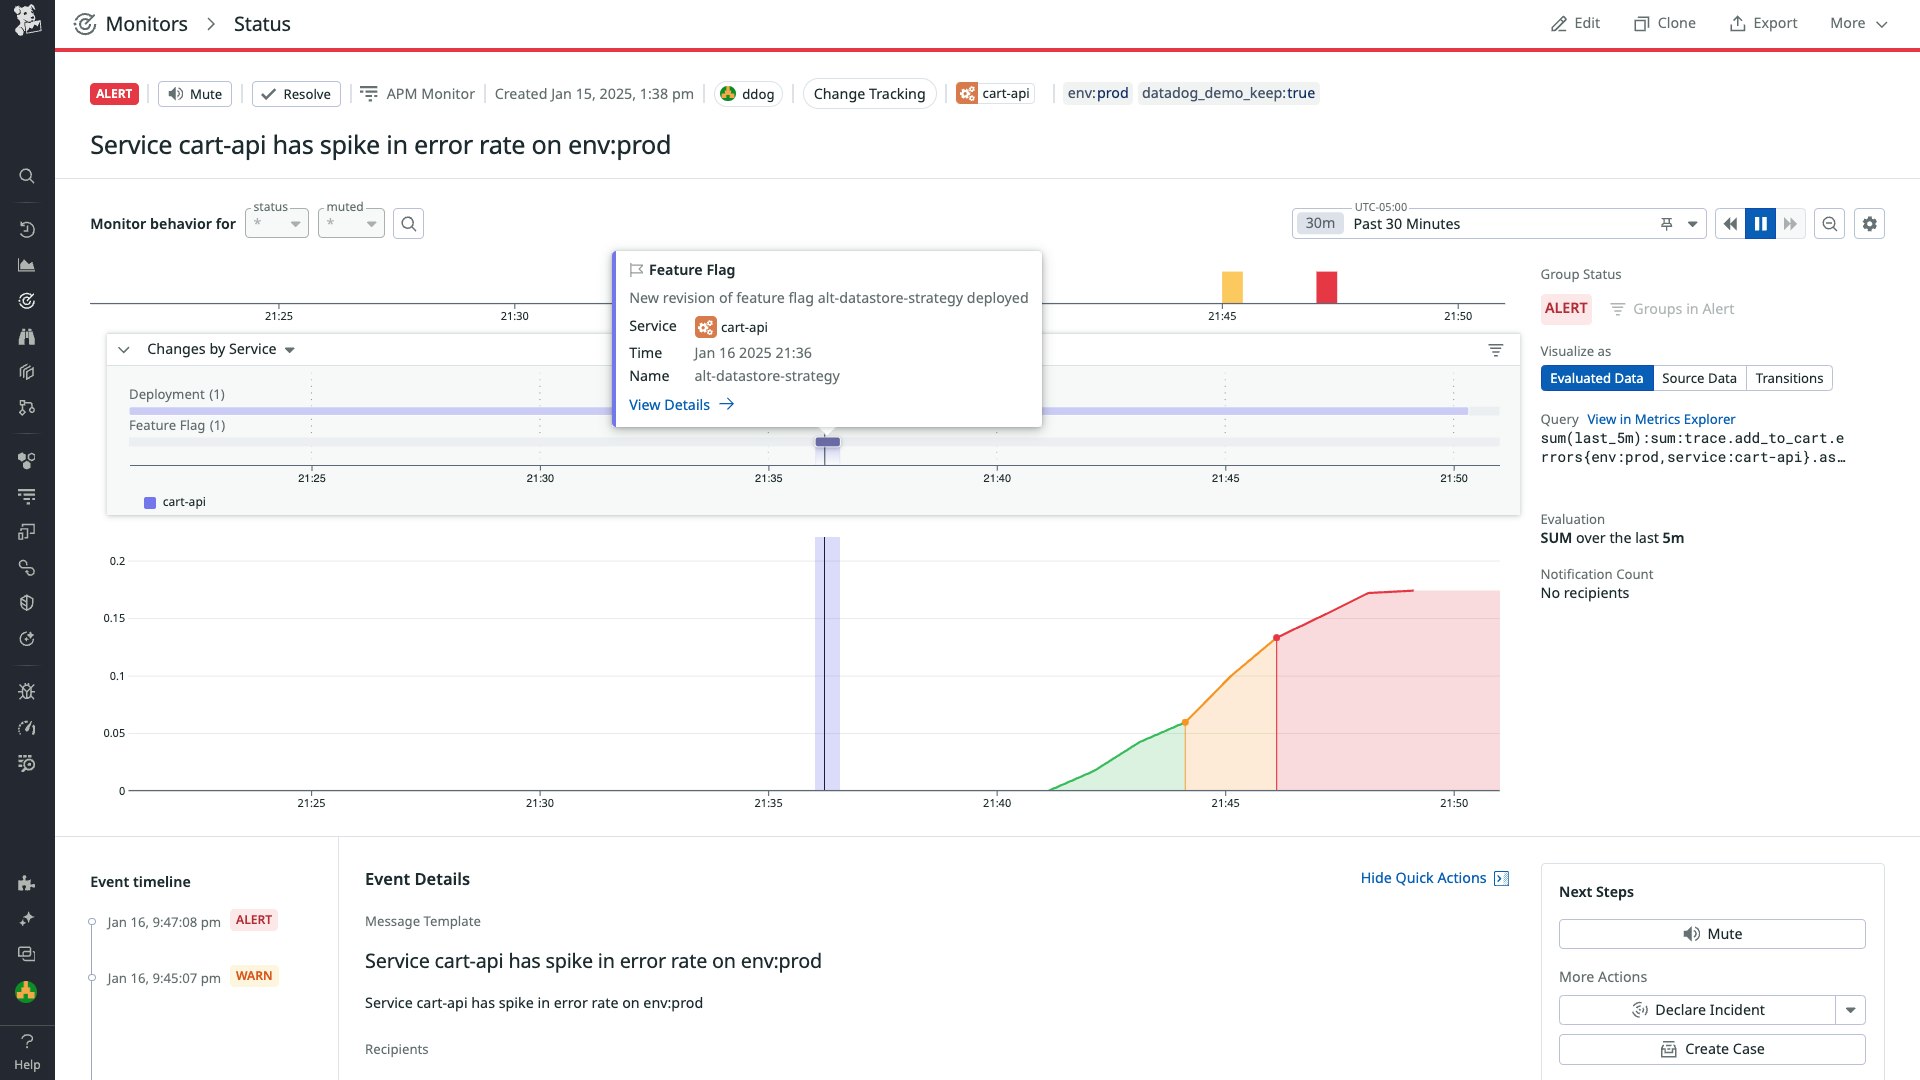
The following screenshot shows a monitor status page for our example API that is experiencing an increase in error rate. Here, we see that Change Tracking is surfacing a deployment change and a feature flag change as potential root causes for you to investigate.
Correlate recent changes with disturbances in service health and performance
With relevant changes automatically surfaced, you can use Change Tracking to correlate these events with the spike in error rate. Hovering over individual change events, such as the feature flag change, reveals details to streamline your analysis. Among these details are the associated service name and the timestamp of the change.
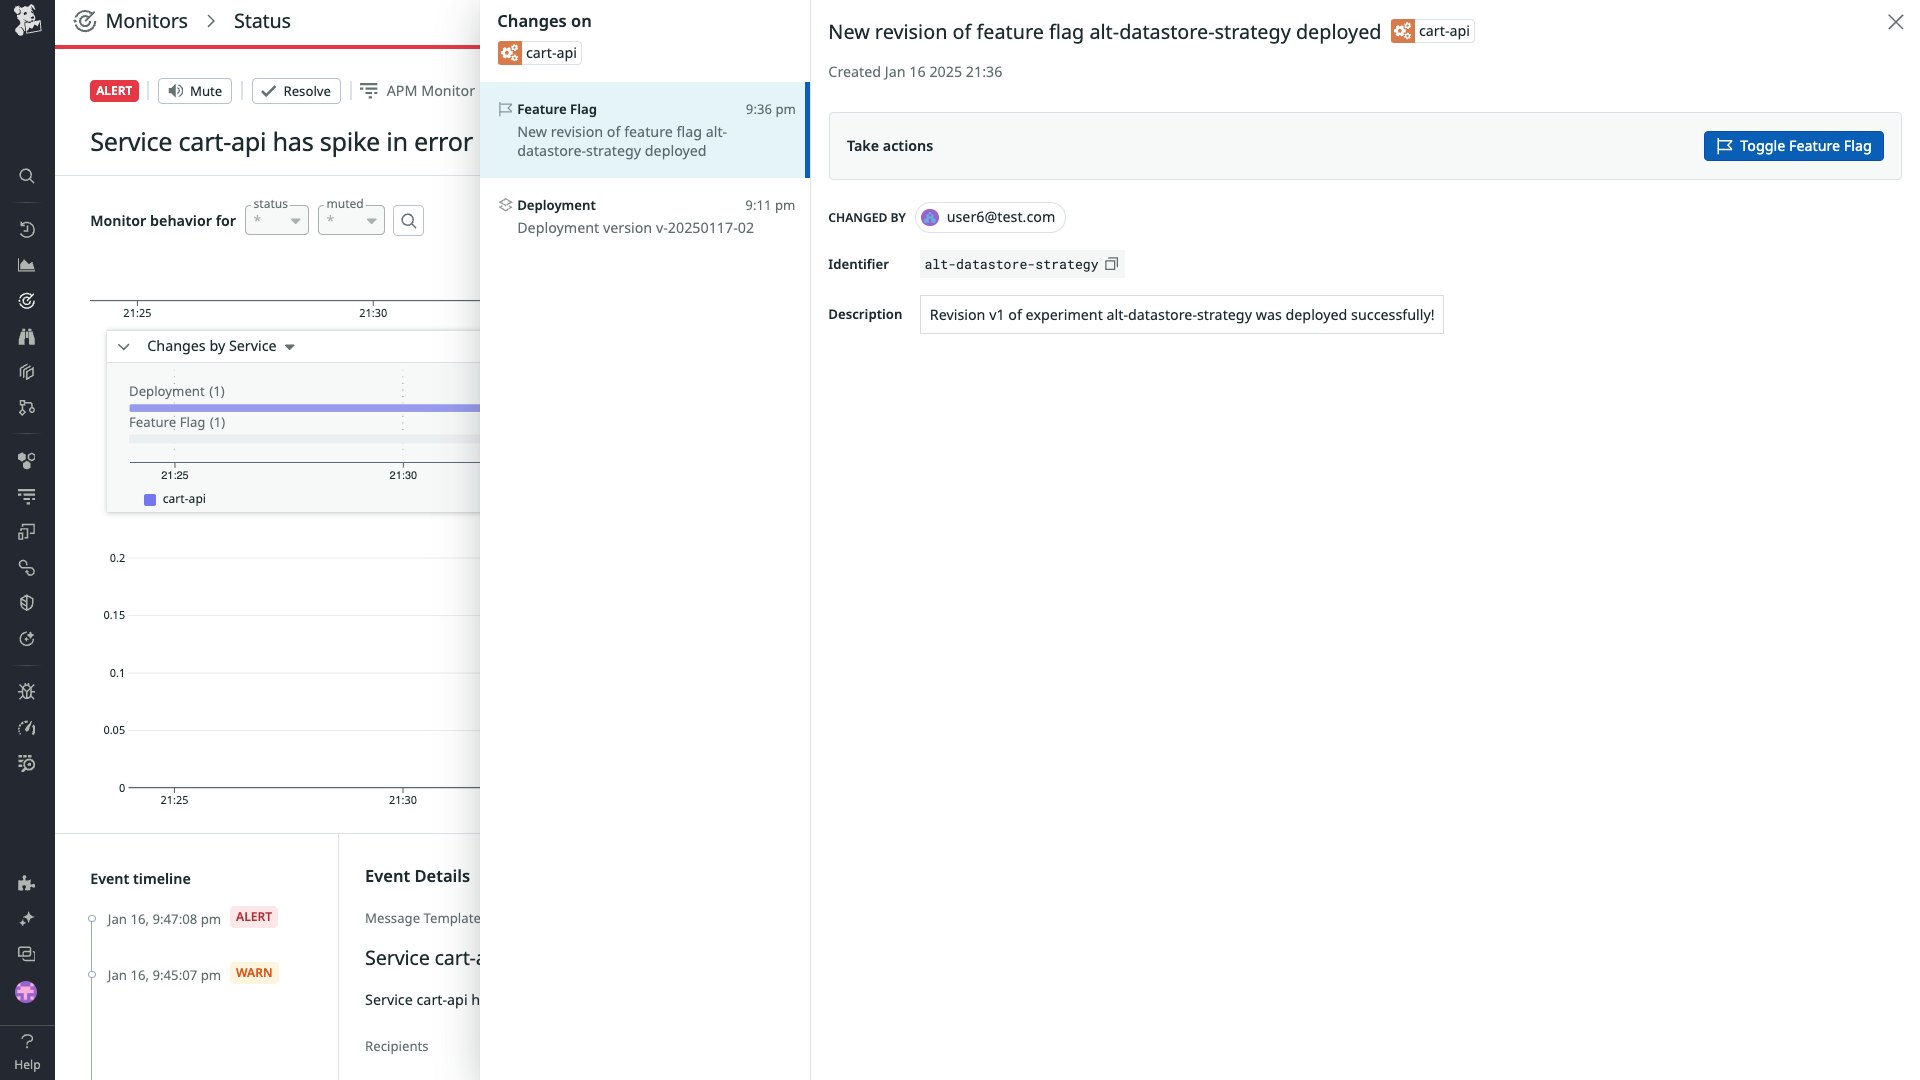
By choosing View Details on the feature flag change, you open the change details side panel. Here, you discover that the feature flag was toggled on and introduced a configuration that directs the API to a different data store. While this change could have contributed to the increased error rate, you don’t know for sure.
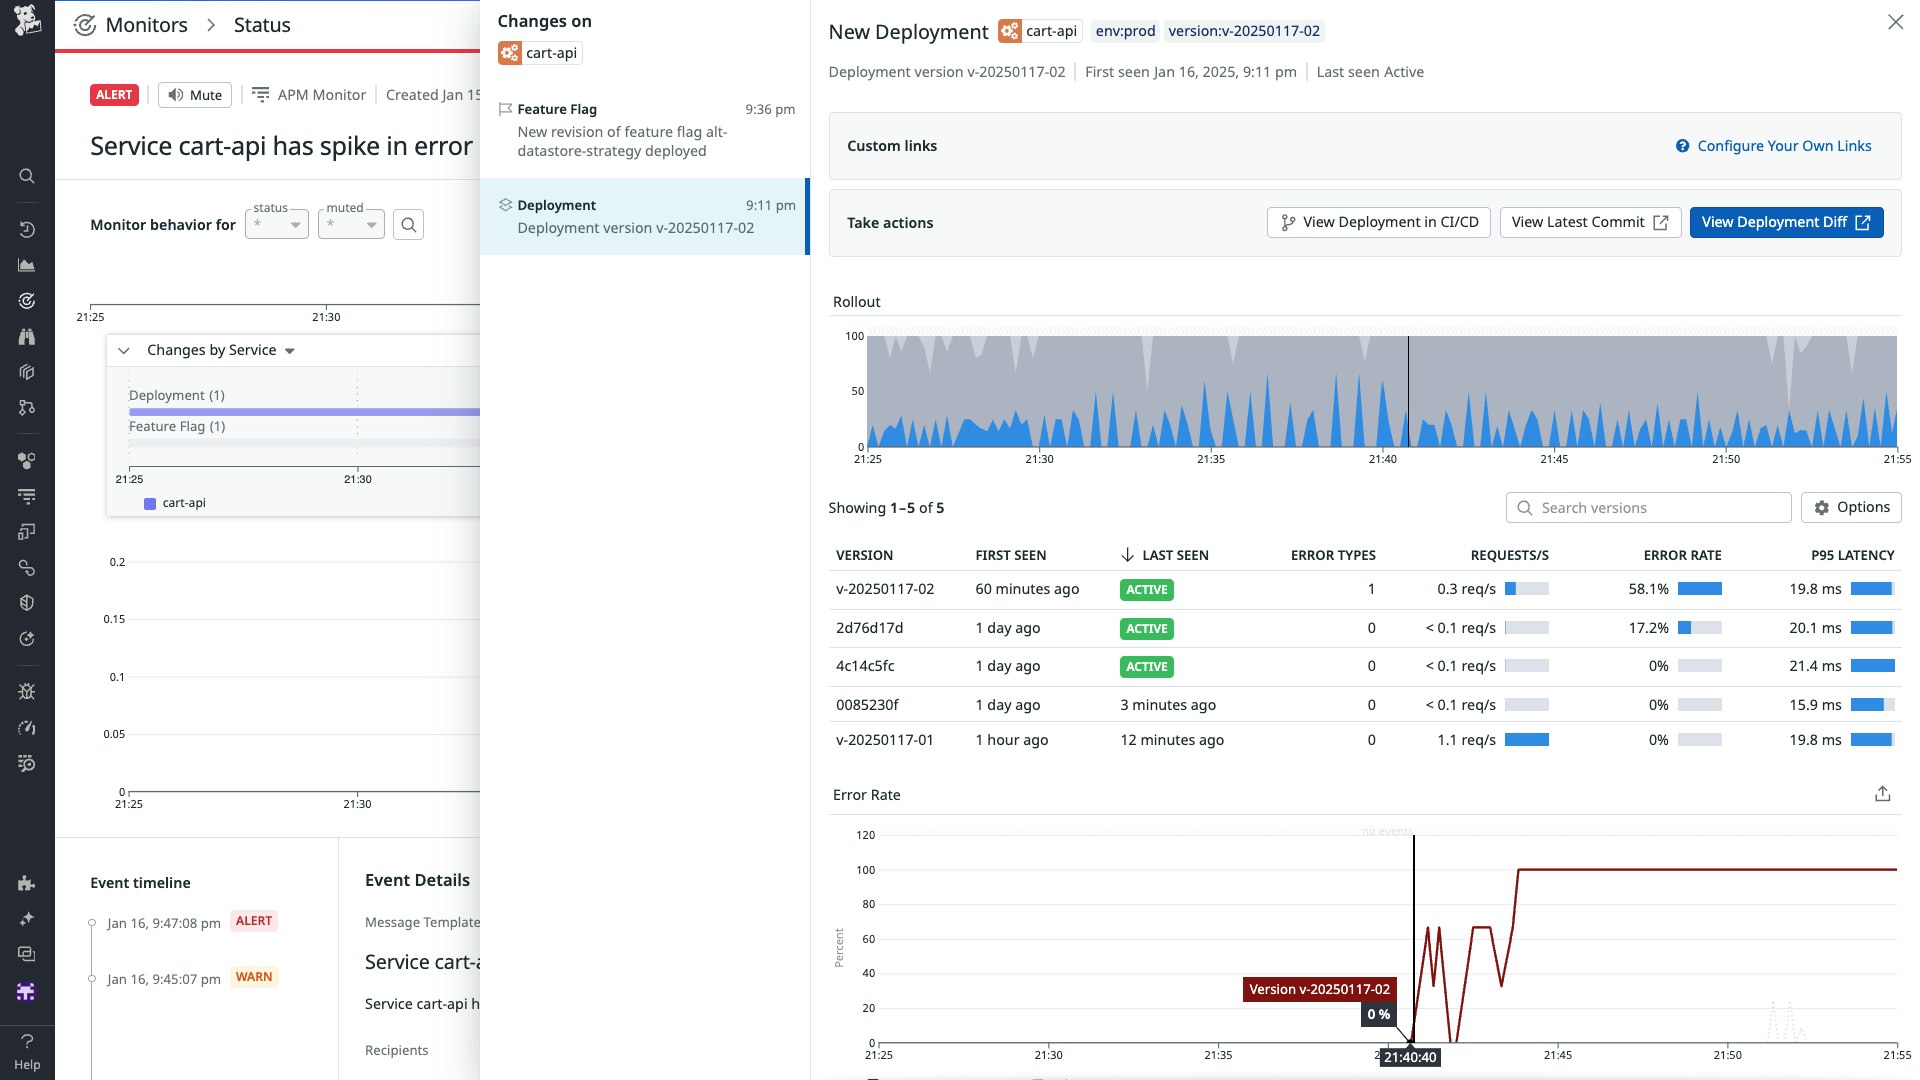
You can then shift your investigation to the deployment. When you review the latest commit linked to the deployment, you uncover code changes that didn’t properly account for the increased load conditions on the new data store. The code changes caused the spike in errors when the feature flag was enabled.
Access detailed change insights and take next steps within Datadog
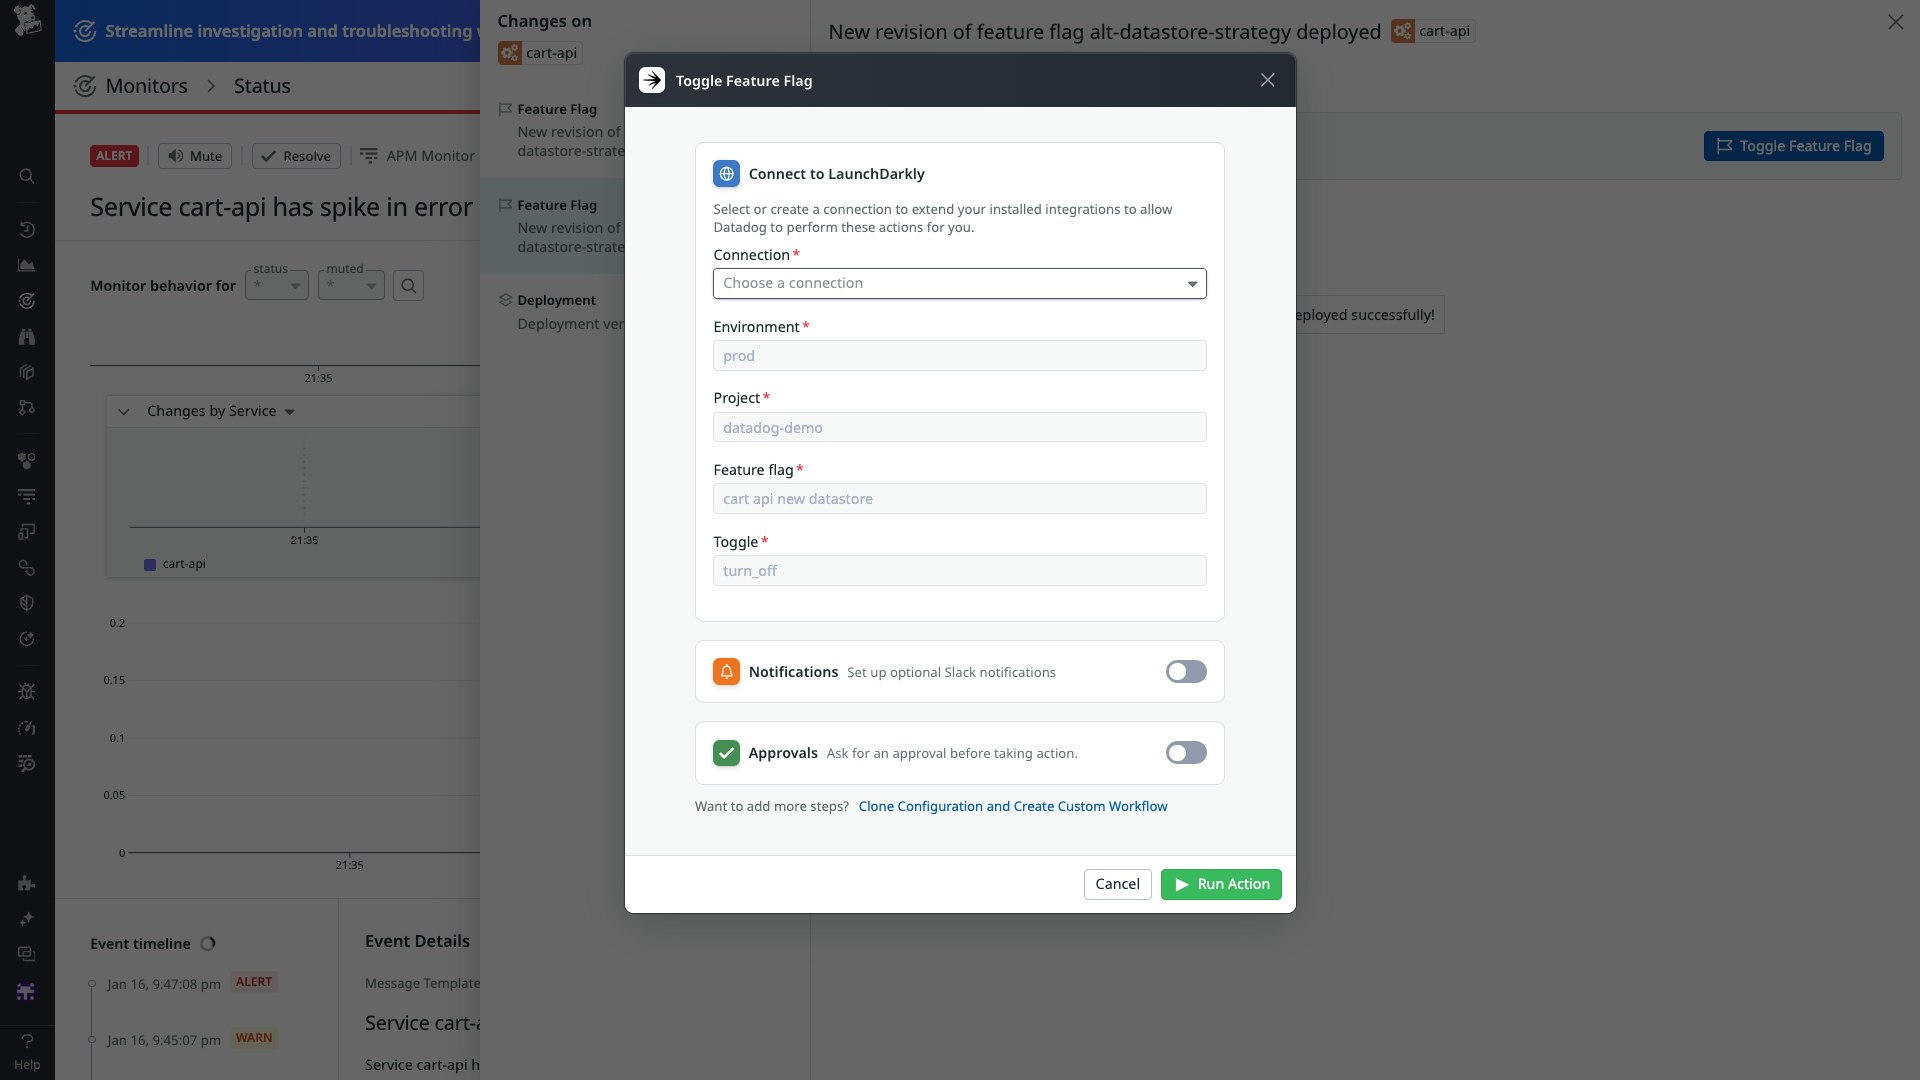
Now that you have identified the root cause as a combination of the faulty deployment and the feature flag, you can focus on stabilizing the system. You determine that the most efficient way to address the issue is to toggle off the feature flag, redirecting traffic back to the original data store. If you have configured the LaunchDarkly integration in Datadog, you can toggle off the feature flag directly in the Change Tracking side panel by using the LaunchDarkly remediation workflow powered by Datadog Workflow Automation. Alternatively, you can set up a custom workflow or manage the flag externally, depending on your internal processes and preferences.
The change details and available actions in Change Tracking are dynamic and tailored to the type of change. For example, application deployment changes include rollout details, version differences, and links to CI/CD pipelines. Conversely, Kubernetes deployment changes provide diffs, cluster metadata, and quick links to logs and pods. Change Tracking gives you the right context and tools for different types of tracked changes, enabling in-depth analysis and efficient responses across a wide range of use cases.
Get started with Change Tracking today
Datadog Change Tracking provides comprehensive visibility into changes across your services and dependencies, integrating insights into monitor status pages, dashboards, and service pages. With Change Tracking, you can view changes, correlate the changes with performance data, and take next steps to remediate issues. As a result, you can improve efficiency and reliability by identifying root causes and resolving incidents faster.
You can find a comprehensive list of supported change types and tracking requirements in the Change Tracking documentation. If you don’t already have a Datadog account, sign up for a 14-day free trial today.
