


James Frullo
While building our Service Level Objectives (SLO) product, our team at Datadog often needs to consider how error budget and burn rate work in practice. Although error budgets and burn rates are discussed in foundational sources such as Google’s Site Reliability Workbook, for many these terms remain ambiguous. Is an error budget some static number of requests or a percentage of requests? Does burn rate indicate how fast I’m spending a fixed quantity, or is it just another way to express error rate?
In this post, we’ll demystify the concepts of error budgets and burn rates. First, a spoiler—a burn rate is almost the same thing as an error rate (with one significant improvement), so if you care about the error rate for a service, you should care even more about the burn rate.
What is an error budget?
One way to think about error budget for SLOs is that all services have an acceptable error rate. You should never set out to be 100 percent reliable because that means you are promising 0 percent error rates (i.e., your service will never fail), which is unachievable for most real-world services. Once you accept that your service will have some errors, then you’re allowing yourself a “budget” for errors which you can then “spend” over time.
This is the first point where confusion creeps in. It’s hard to find a firm definition of error budget in the Google SRE Workbook; in Appendix B, we get a seemingly straightforward definition:
An error budget is 1 minus the SLO of the service. A 99.9% SLO service has a 0.1% error budget.
Technically, it should be defined as one minus the target of the SLO rather than “one minus the SLO.” This seems like a simple enough definition, but in other places, you’ll see the error budget defined as an amount of time or a number of requests. Where do these numbers come from and how can they also be the error budget?
Let’s say we have a web store service with a 99 percent SLO target. In that case, our error budget is:
error budget = 1 - target = 1 - .99 = 0.01, or 1%
Suppose our service had a total of 70,000 hits over seven days. We can calculate how many errors we are allowed before breaching our SLO.
errors before breach = hits error budget = 70,000 x 0.01 = 700
Therefore, we can have 700 errors over seven days and still meet our SLO. Some people would call this number—700—our error budget instead of 1 percent.
There’s another kind of SLO based on uptime, and over a seven-day period, the amount of allowed downtime might also be called the error budget. In the case of a 99 percent target, we calculate allowed downtime as:
allowed downtime = 7 days x .01 = .07 days = 1 hour, 40 minutes, 48 seconds
An error budget, then, could refer to a percentage, a number of hits, or an amount of time, making it difficult to determine what usage is most appropriate.
How error budgets are interpreted
As we’ve seen, there are two ways to interpret an error budget: as a quantity (number of requests, number of minutes, etc.) or as a percentage (allowed or ideal error rate). For our example web store, our error budget is 1 percent according to the percentage interpretation but 700 requests according to the quantity interpretation.
Which interpretation is right? You might expect us to say that there’s value in both interpretations. But the quantity interpretation is less useful for one important reason—SLOs are typically calculated over rolling window time frames.
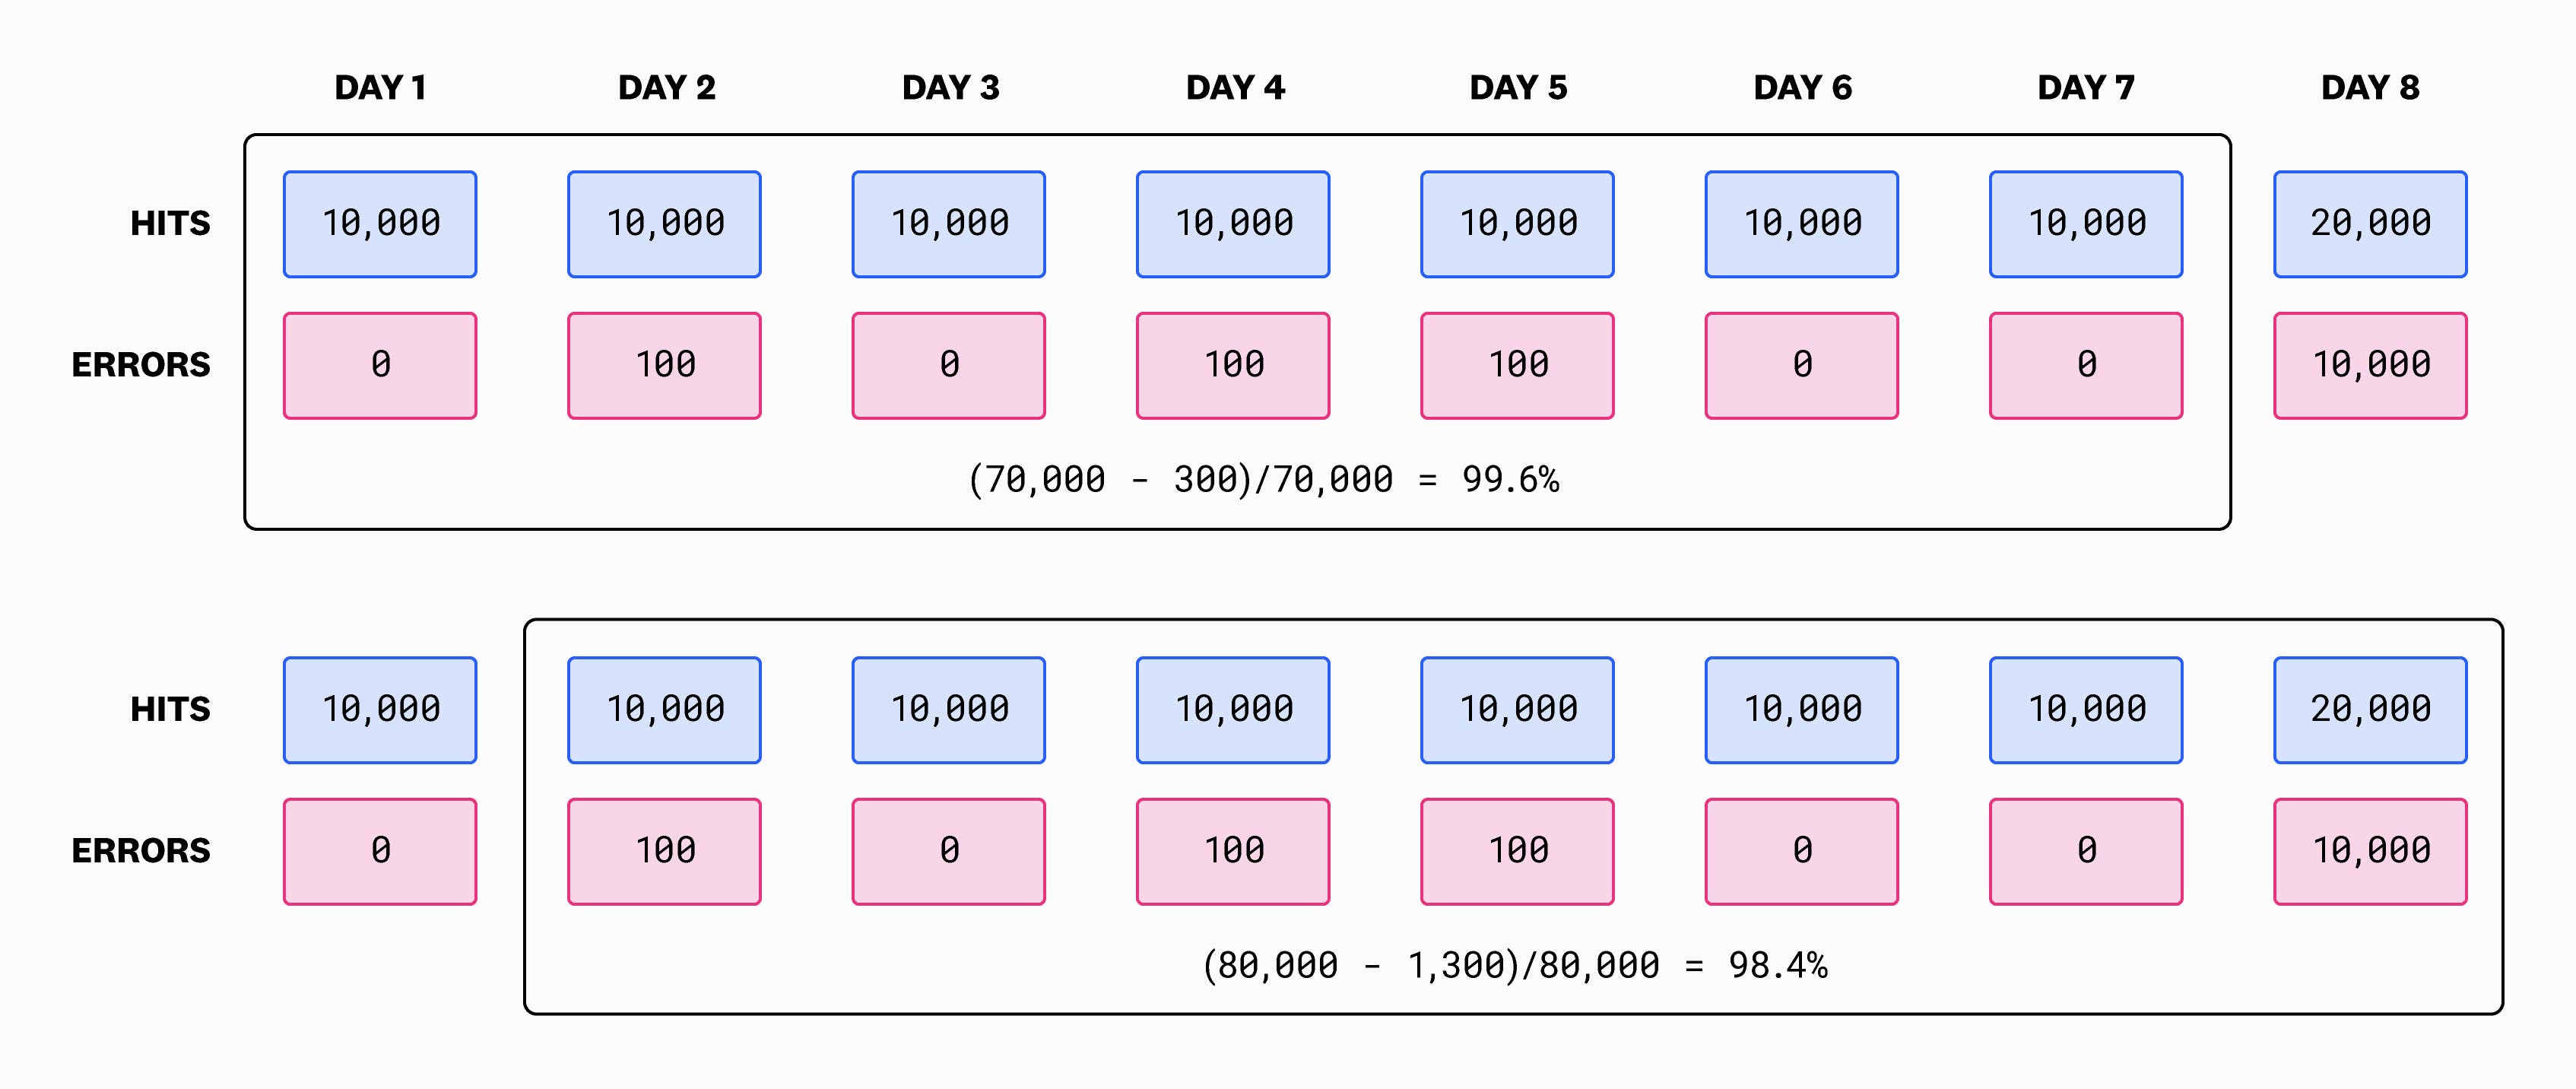
As the above diagram shows, over an initial seven day time frame we were meeting our 99 percent target since our SLI was 99.6 percent. One day later, however, we see that our SLI is at 98.4 percent, meaning we are out of compliance. In general, the status can change not just from day to day but from minute to minute. Old errors roll out of our rolling window and new errors roll in, and total hits are also changing constantly. We had an error budget of 700 errors, but then one day later, it was 800 errors (80,000 hits x 0.01 error budget = 800). The same is true for uptime because old downtime rolls out of the rolling window. Since the total time stays constant, the quantity interpretation for uptime is certainly more stable. In any case, the quantity interpretation of error budget yields a variable and not a constant, and that makes it hard to use because it’s hard to hit a moving target.
It’s important to keep in mind the ambiguity around what “error budget” refers to as we begin to talk about our next topic: burn rate.
Defining burn rates
The burn rate concept is explained in the Google Site Reliability Workbook in Chapter 5.
Burn rate is how fast, relative to the SLO, the service consumes the error budget.
Put simply, burn rate is the ratio of your error rate to your error budget (the percentage).
For example, on Day 2, our web store service had 100 errors during the day (see Figure 1):
Note that since burn rate is the ratio of two error rates, it’s a unitless number. A burn rate value of one indicates you are on pace to exactly burn through your error budget. Any rate above one means that you’ll exceed your budget if you sustain that rate. For example, a sustained rate of two will mean you’ll exceed your budget in half of the SLO time frame.
This is how the Google book visualizes burn rate:
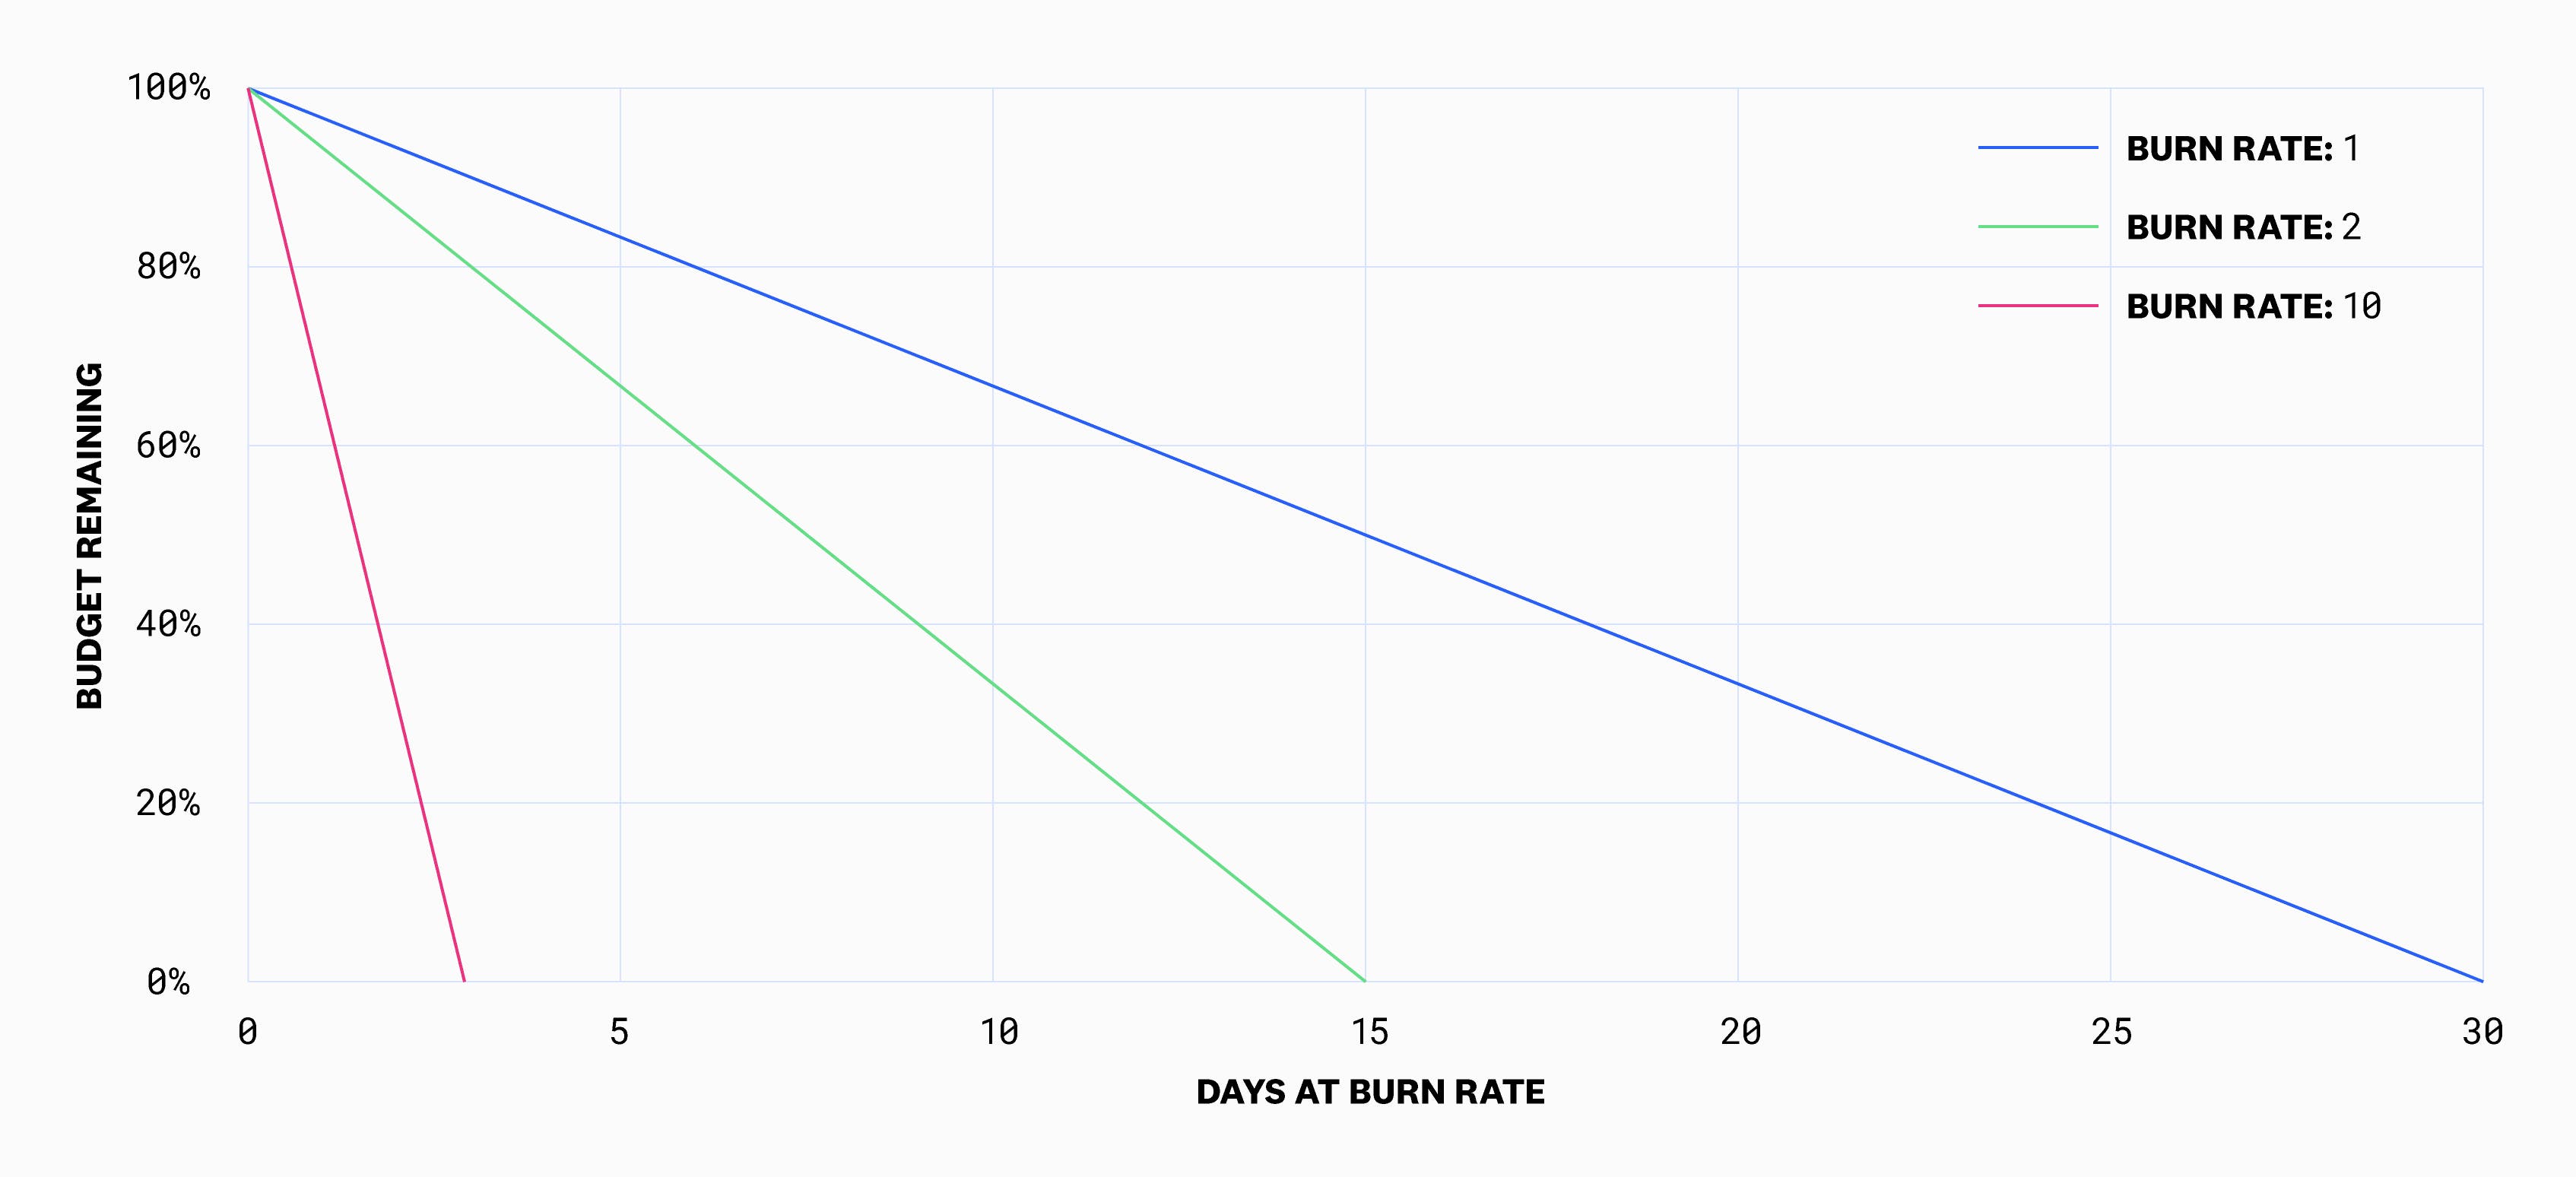
Here, the example uses a 30-day SLO. A burn rate of two means the error budget will be exhausted after 15 days—half of the SLO time frame. A burn rate of 10 means the error budget will be exhausted in just 3 days—one tenth of the SLO time frame. However, thinking about time until exhaustion can also be confusing because it’s only theoretical. It assumes a constant burn rate, but burn rate is typically moving around just as the error rate is moving around. Remember, the burn rate is directly proportional to the error rate.
Though burn rate is nearly identical to error rate, our stance is that burn rate is a better error rate. Looking at an error rate in isolation, you might ask: is this error rate too high? Burn rate answers this question by taking into account the expected error rate—i.e., the error budget—which was decided on by the service owners in accordance with their service reliability goals. The ratio of error rate to error budget is useful because if it is at or below one, the error rate is acceptable. If it’s higher than one, the error rate is higher than the service owner would expect.
Looking at burn rates over different time intervals
Now that we’ve defined what a burn rate is, let’s look at another really important dimension: the time frame associated with burn rates. Because burn rates are typically used for alerting, they are more useful over periods of time much shorter than SLOs. You want to know if you’re having an incident right now—not days later.
Let’s look at an example. With our web store service, we saw that we were getting 10,000 hits per day. Zooming in, we can use 10-minute intervals instead of one-day intervals for higher granularity:
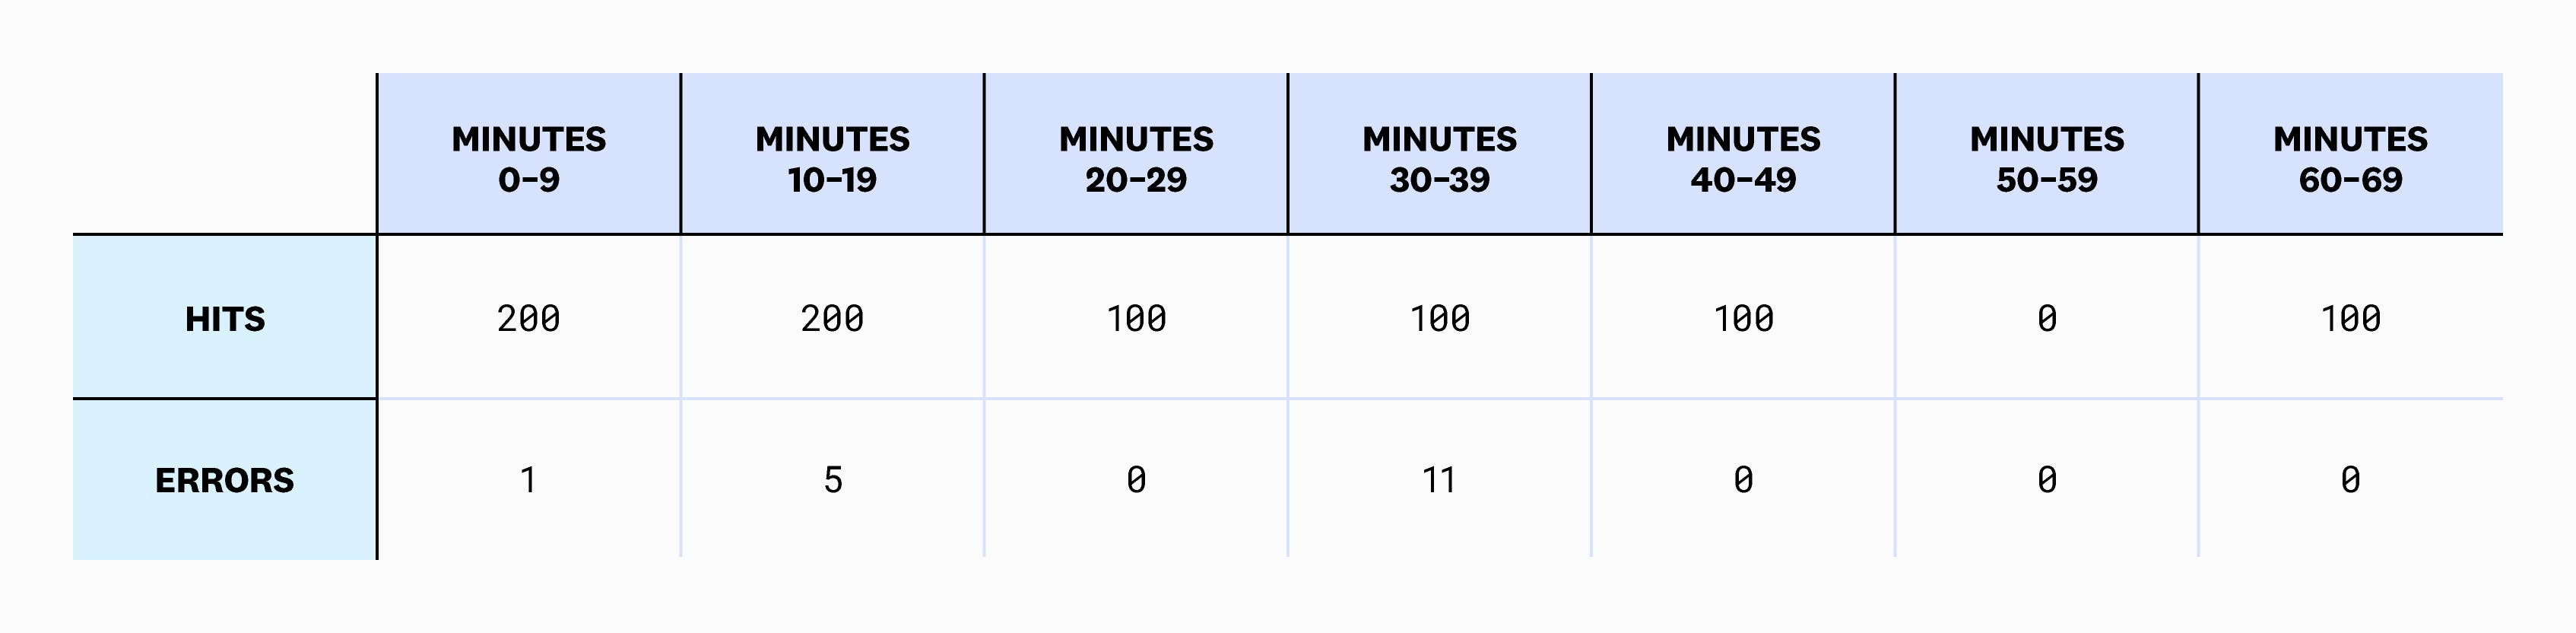
Using this data, we can compute burn rate over a variety of intervals. For example, here are the burn rates for the first seven 10-minute intervals.
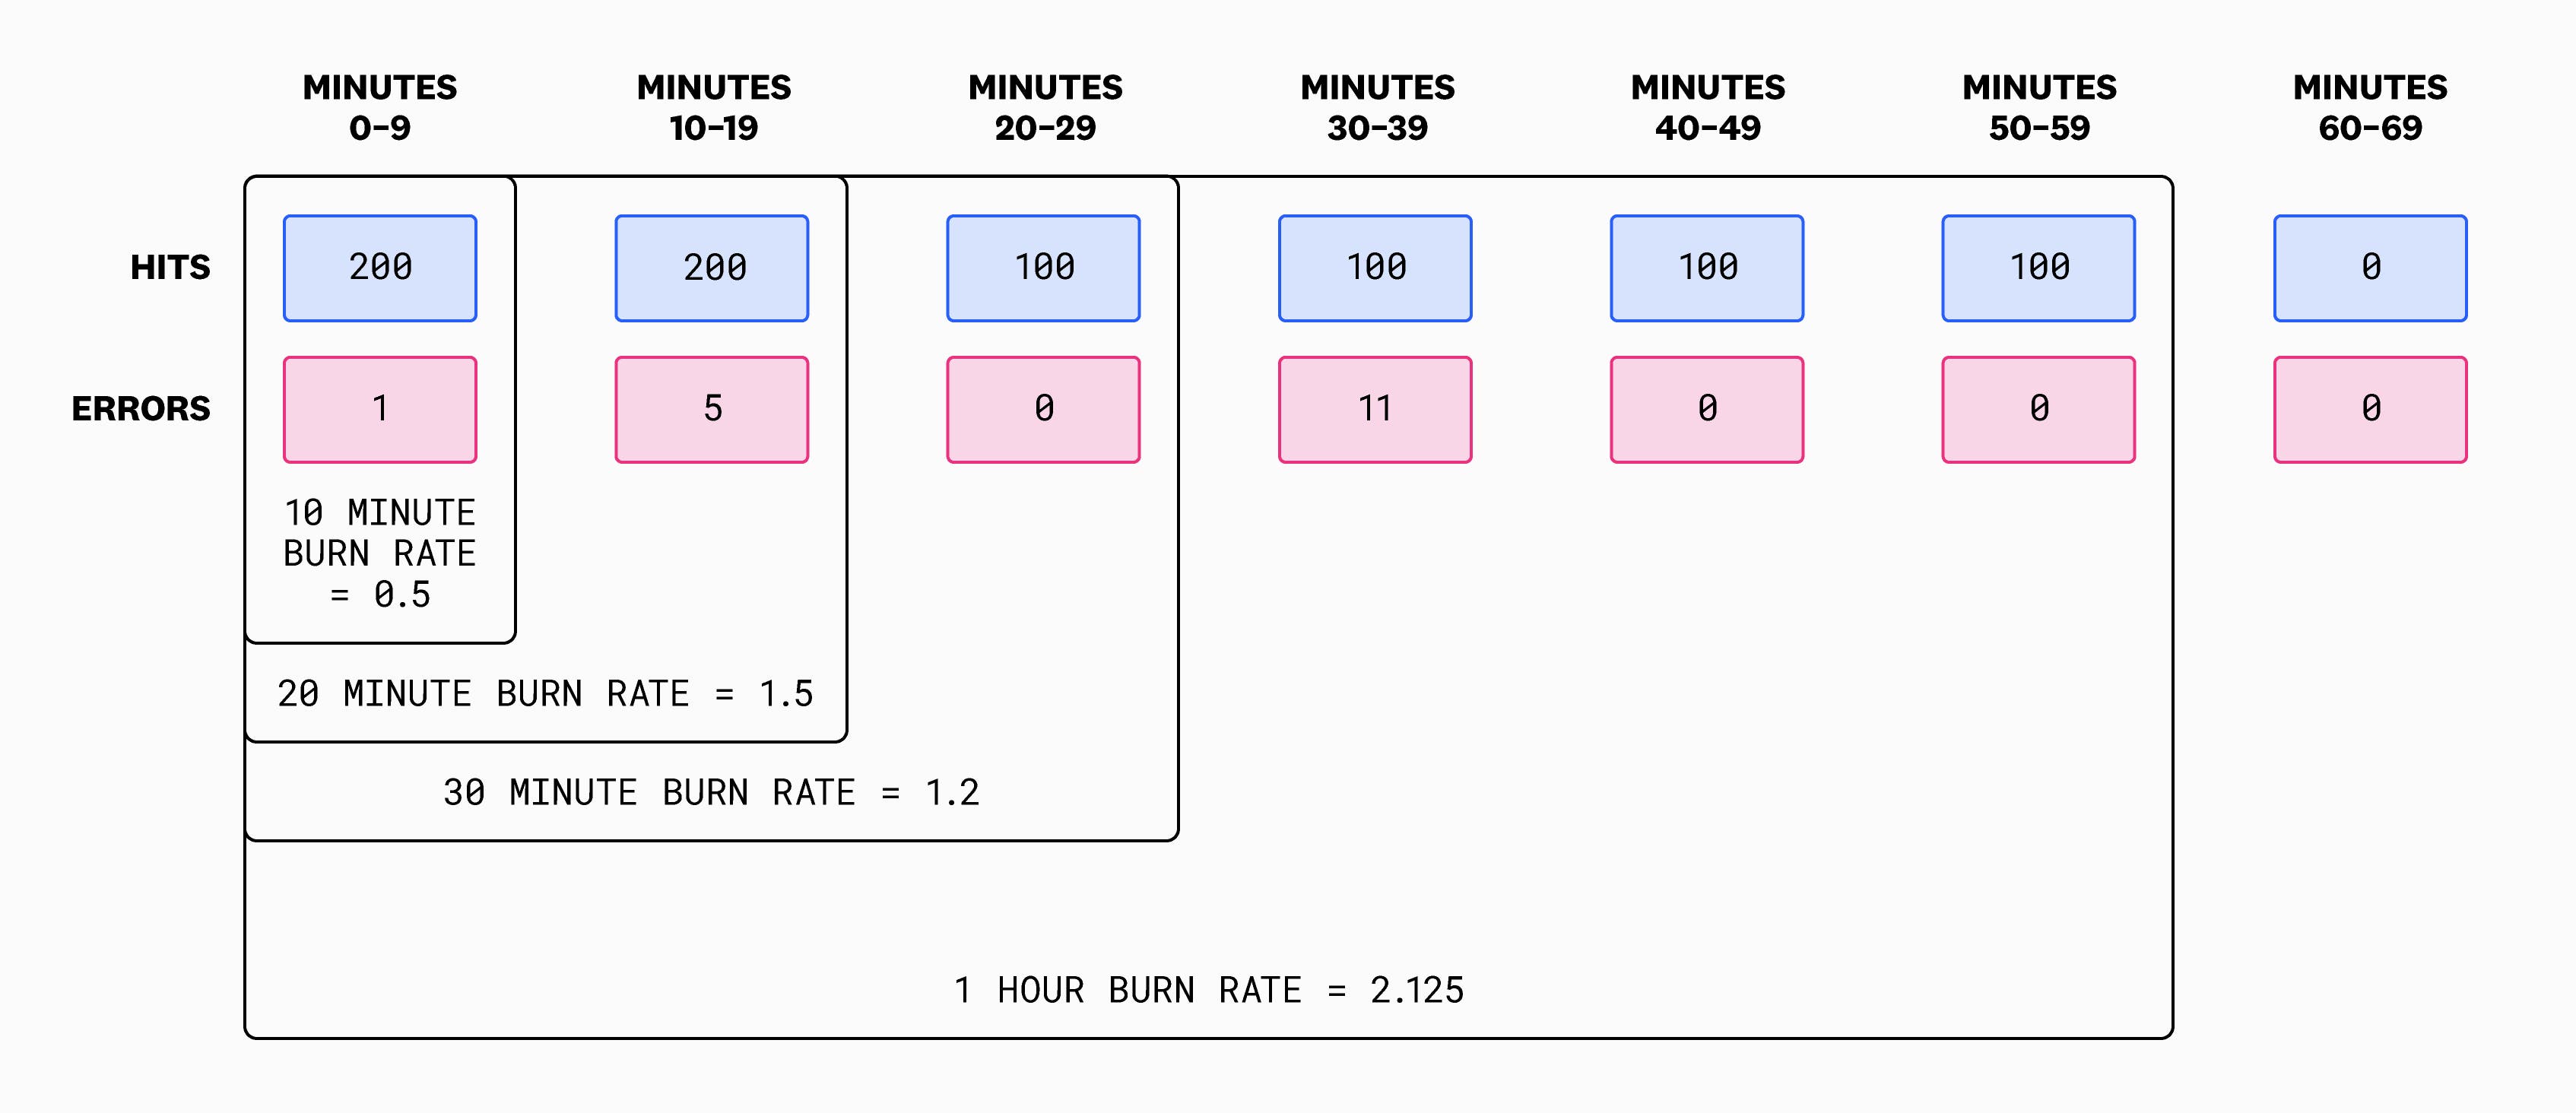
Suppose we want to create an alert when the burn rate for the web store is high. In this example, we’ll use 10-minute intervals. We’ll set up our alert to go off when the burn rate exceeds 10, which is a reasonable threshold for an alert because it means our error rate is 10 times higher than it ideally should be. So, let’s compute the burn rate for each of these intervals:
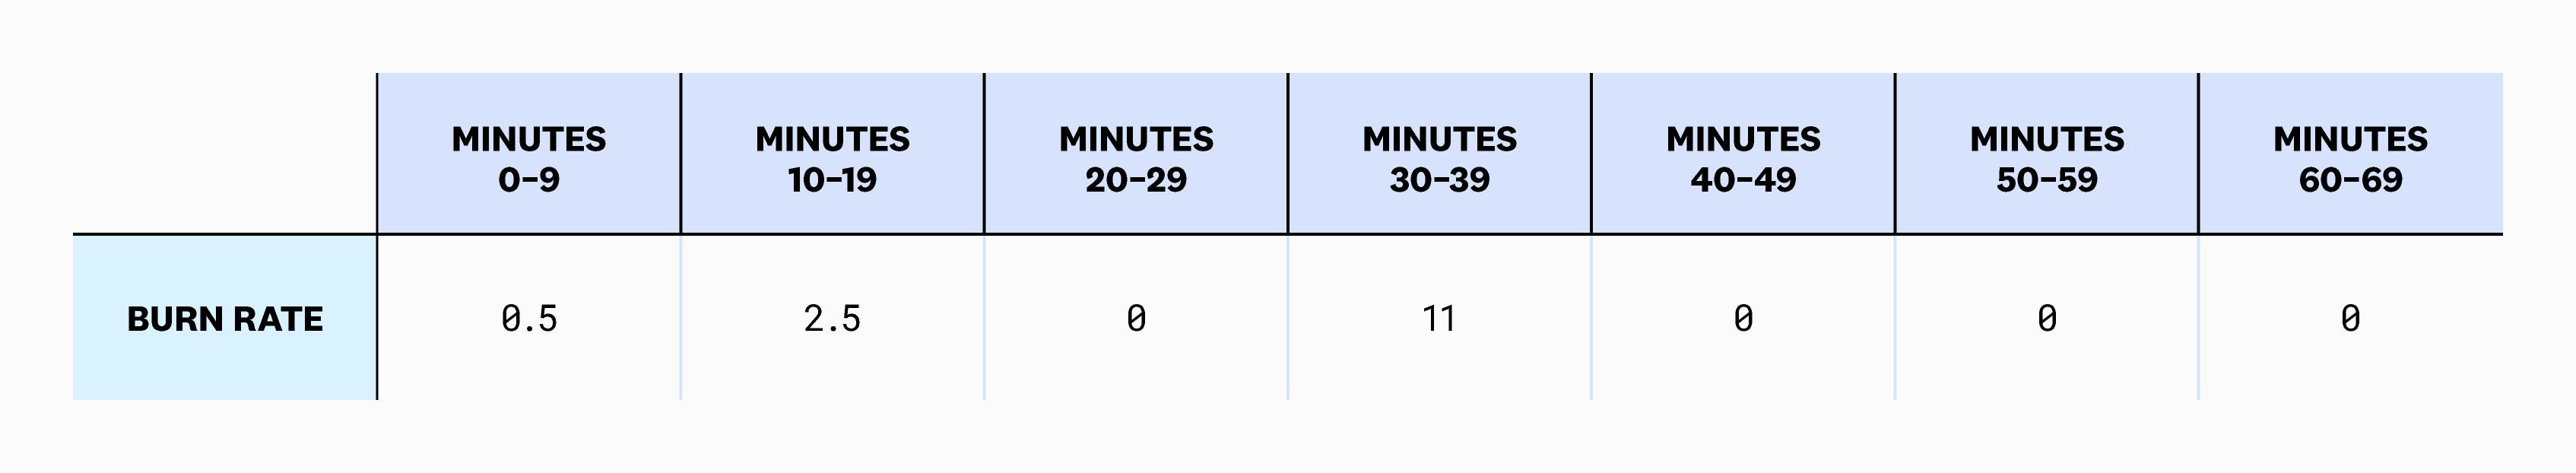
At minute 30, we see that the burn rate exceeds our threshold of 10, and so we would be alerted at this point. Note that this is identical to a traditional error rate monitor with an error rate threshold of 10 percent (since our error budget is 1 percent, and 10 percent is ten times higher than that).
Using our initial error budget example from above, we calculated that we’re allowed to have 700 errors over the course of seven days. If we spread this out, that comes to nearly 0.7 errors every 10 minutes. So how did we calculate a burn rate of 0.5 for the first 10-minute interval? We overspent our budget by having one error, didn’t we? No, because of the difference between the quantity and percentage interpretations of error budget. The 0.7 errors we just calculated uses the quantity interpretation, which has the problems discussed earlier in this post. Using the percentage interpretation, what we care about is the recent error rate, not the absolute number of errors. Thus, we calculate 0.5 because there were 200 hits and just one error.
Common misconceptions about burn rate
Now let’s address a few common misconceptions about burn rate.
Burn rate calculation is complicated
Calculating burn rate is actually very straightforward. As shown above, you simply need to divide the error rate by the error budget (the acceptable error rate).
The SLO time frame matters
You can calculate burn rate over any time frame. The error budget is simply one minus the SLO target, so it does not depend on the SLO time frame. Both the error rate and, consequently, the burn rate can be computed over any time frame. A burn rate alert requires at least one time frame (a more sophisticated burn rate alert uses two time frames to reduce noise but recover quickly). This time frame is not related to the SLO time frame.
However, there is one important use for the SLO time frame when choosing burn rate thresholds for alerting. The common advice given is that you should set the burn rate threshold based on the percentage of the error budget that you are comfortable with spending while taking into account the ratio of the alerting time frame to the SLO time frame. For example, if you use a one-hour burn rate for alerting and your SLO time frame is seven days, then the alerting time frame is just 0.6 percent of the SLO time frame. That means you’re allowed to spend approximately 0.6 percent of the error budget each hour. How much of your error budget do you think is okay to spend in that time? If your answer is 10 percent, then the correct burn rate to choose is 0.1/0.006=16.8.
When people choose thresholds for alerting—for both burn rate alerts and classic error rate alerts—they don’t often think about this percentage of error budget calculation at all. Instead, they ask themselves how frequently they will get alerted and if those alerts seem to reflect real problems. These are related questions because setting achievable targets for your SLO means you should not frequently be exceeding 10 percent of your error budget inside of one hour. But in the real world you can’t control the number of hits you get in one hour. And 10 percent of the requests in one hour probably will not end up being 10 percent of your error budget after seven days have passed. It will likely be more or less than that, so it’s reasonable to choose burn rate thresholds empirically rather than based on theoretical error budget consumption.
Quantity matters
The quantity interpretation of error budget as a number of requests to a service is not typically used to compute burn rate. Remember, burn rate is calculated as error rate divided by error budget (the percentage). Working with a quantity-based error budget can lead to confusion. If we imagine a service that gets 100 requests per minute, or 1,008,000 requests per week, a 99 percent target means our quantity-based error budget is 10,080 errors per week. If we spread that evenly over 10-minute periods, we have a budget of 10 errors per 10-minute period. But suppose we’re at a low-traffic time for the service, and in 10 minutes, we get just 10 hits instead of the expected 1,000 hits and each of these are errors. So our burn rate is 100 (100 percent divided by 1 percent). But we have spent our exact error budget of 10 hits, so shouldn’t our burn rate be one? This is where the quantity interpretation leads us astray. Remember that the number of hits per week is always changing if we use a rolling seven-day time frame with our SLO. So while all the math seems to make sense for a constant number of hits per week, that number is not a constant, and so our error budget would also always be changing if we used the quantity interpretation.
If you’re left bothered by the fact that using a percentage definition of burn rate can lead to alert noise during low traffic periods, see the “Low-Traffic Services and Error Budget Alerting” section in Chapter 5 of the Site Reliability Workbook.
There is only one burn rate
There are many burn rates. You can’t talk about burn rate without mentioning what time frame it is measured over, and burn rates can be computed over any time frame. A one-hour burn rate, five-minute burn rate, and a 30-day burn rate all have value.
Better alerting with burn rates
If you’re monitoring services, you likely have dashboards that prominently display the error rate and alerts that notify you when the error rate is high. You should, however, consider replacing error rate with burn rate.
For starters, you’ll get better visibility and actionability. If the error rate for a service is 2 percent, someone unfamiliar with the service won’t know if that’s acceptable or not. Since burn rate is scaled based on the target error rate (i.e., the error budget), it captures both the error rate and the expected error rate in one number. High burn rate is always bad, and a burn rate above one is always higher than expected regardless of the service involved. This enables standardized alerting across services and endpoints.
Replacing error rates with burn rates also results in less noisy alerting. Simple burn rate alerts aren’t any different from error rate alerts, so it’s difficult to claim you’ll get less noise by using burn rate alerts. This advantage comes with a caveat: you can achieve less noise if you use multiple windows as described in the Google Workbook (see “Multiwindow, Multi-Burn-Rate Alerts” in Chapter 5). A two-window burn rate alert will only trigger if the burn rate over both windows is above a threshold. The reason this reduces noise is the longer window prevents temporary spikes from triggering the alert, so it has more inertia. However, once you’re paged and you fix the problem, you won’t have to wait for the errors to clear from the long window for the alert to clear. The short window will result in faster recovery, giving you both reduced noise and quick recovery.

Wrapping Up
In this post, we discussed the ambiguity around error budget—primarily, the difference between quantity and percentage interpretations of the error budget. We discussed how burn rates are an improvement over simple error rates, along with common points of confusion around burn rate calculation. Finally, we made the case that burn rate provides better visibility and less noise on your dashboards and in your alerting when compared to error rate.
To learn more about SLOs, check out our posts on how to establish and manage them with Datadog.
And if you’re new to Datadog, sign up today for a 14-day free trial.


