Candace Shamieh

Alex Guo

Erica Ho
Camunda 8 is a process orchestration platform that automates and executes business processes at scale. Many organizations orchestrate their business processes using Camunda 8 Self-Managed because it can operate in their preferred public cloud provider, such as AWS, or in a private cloud, like a Kubernetes cluster. However, hosting Camunda 8 while maintaining its health and performance will require complete visibility into your environment, helping you properly allocate resources and minimize downtime. To effectively manage and optimize orchestration efforts end-to-end, you’ll need a comprehensive monitoring system that enables you to customize alerts, conduct health checks, and collect unique performance metrics that capture the full state of your Camunda 8 components.
Bordant Technologies’ integration provides real-time monitoring of Camunda 8 in Datadog, enhancing the overall reliability and efficiency of your process orchestration efforts. This solution simplifies operational oversight of Camunda 8, helping you proactively identify bottlenecks, verify resource health, and fine-tune performance.
In this post, we’ll discuss how you can:
- Monitor the health of your Camunda 8 components and prepare for peak loads
- Use Datadog alerting for continuous uptime
Monitor the health of your Camunda 8 components and prepare for peak loads
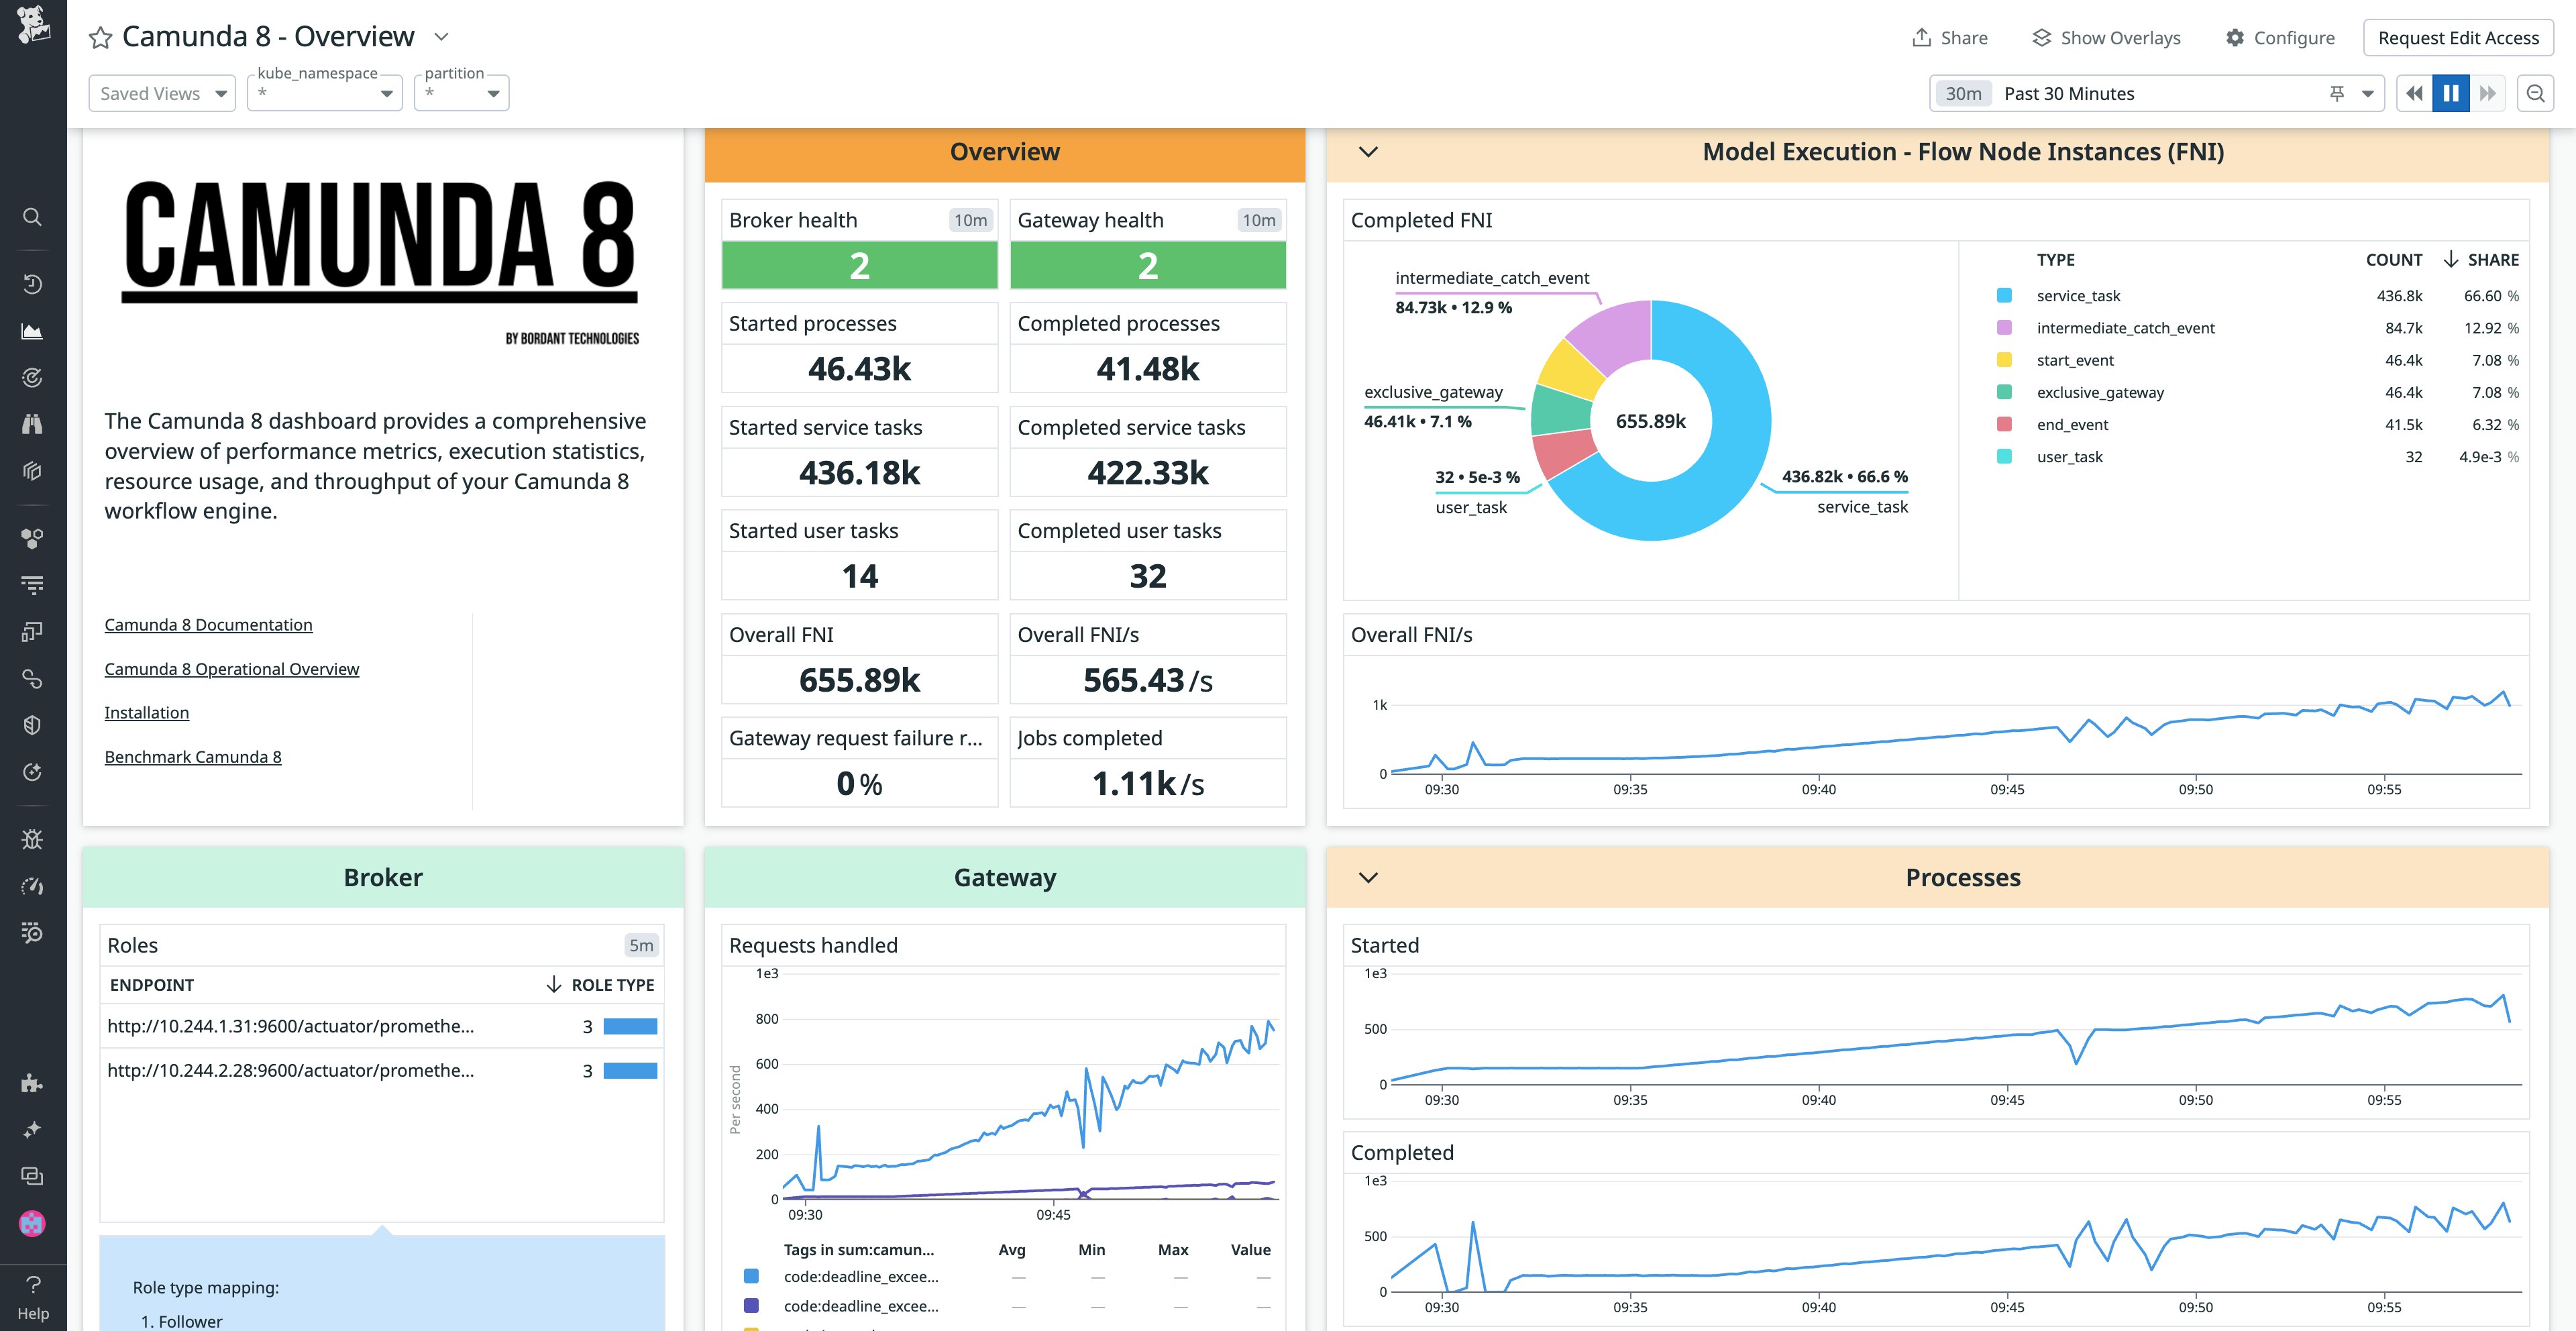
After you install the integration, Camunda 8 metrics will start to populate in Datadog. The Camunda 8 integration collects 157 metrics and includes an out-of-the-box dashboard that visualizes execution statistics, resource usage, throughput metrics, and more.
The Camunda 8 Overview dashboard enables you to monitor the health of Zeebe, the process engine powering Camunda 8. You can gain detailed insights regarding your Zeebe components, like gateways (the entry point to a cluster), brokers (the workflow engines that track processes), and exporters (the system that provides an event stream of the state changes that occur within Zeebe). These metrics allow you to confirm that your Camunda 8 components are available and ready to work.

In the context of Camunda 8, throughput describes how many process state changes can be executed in a given timeframe. The Camunda 8 Overview dashboard visualizes throughput metrics like flow node instances (FNIs), processed tasks, backpressure, and number of processes completed. Having visibility into these metrics helps you quickly identify any errors that occur in your instances, assess runtime behavior, and ensure tasks are processed efficiently. Throughput metrics also enable you to determine whether you need to change cluster configuration, provision additional vCPUs, deprecate underutilized resources, and more. As you fine-tune performance, you can run your own metric-based benchmarks to understand the maximum throughput on a single cluster and size your environment accordingly to prepare for peak loads.
Correlating Camunda 8 metrics with other infrastructure and application metrics that you collect in Datadog allows you to pinpoint the root cause of issues faster and minimize unplanned downtime. As an example, let’s say you work at a telecommunications company that recently deployed Camunda 8 on Kubernetes. The company is currently running a promotion, offering free smartphones to new customers. They use Camunda 8 to orchestrate various backend processes that occur each time a customer joins, such as providing them with a new phone number and updating carrier settings. Through the Camunda 8 dashboard in Datadog, you notice that an alarming percentage of Zeebe Gateway requests are failing, which could lead to brokers becoming overloaded and prevent new customers from joining. You expand the dashboard widget showing the failures and select the related containers option to gain additional context. Scrolling down the Containers page to see the Kubernetes pods, you discover that resources are near exhaustion. You provision more CPU, memory, and disk I/O Kubernetes resources so your Zeebe Gateways can handle incoming requests appropriately.
Use Datadog alerting to maintain continuous uptime
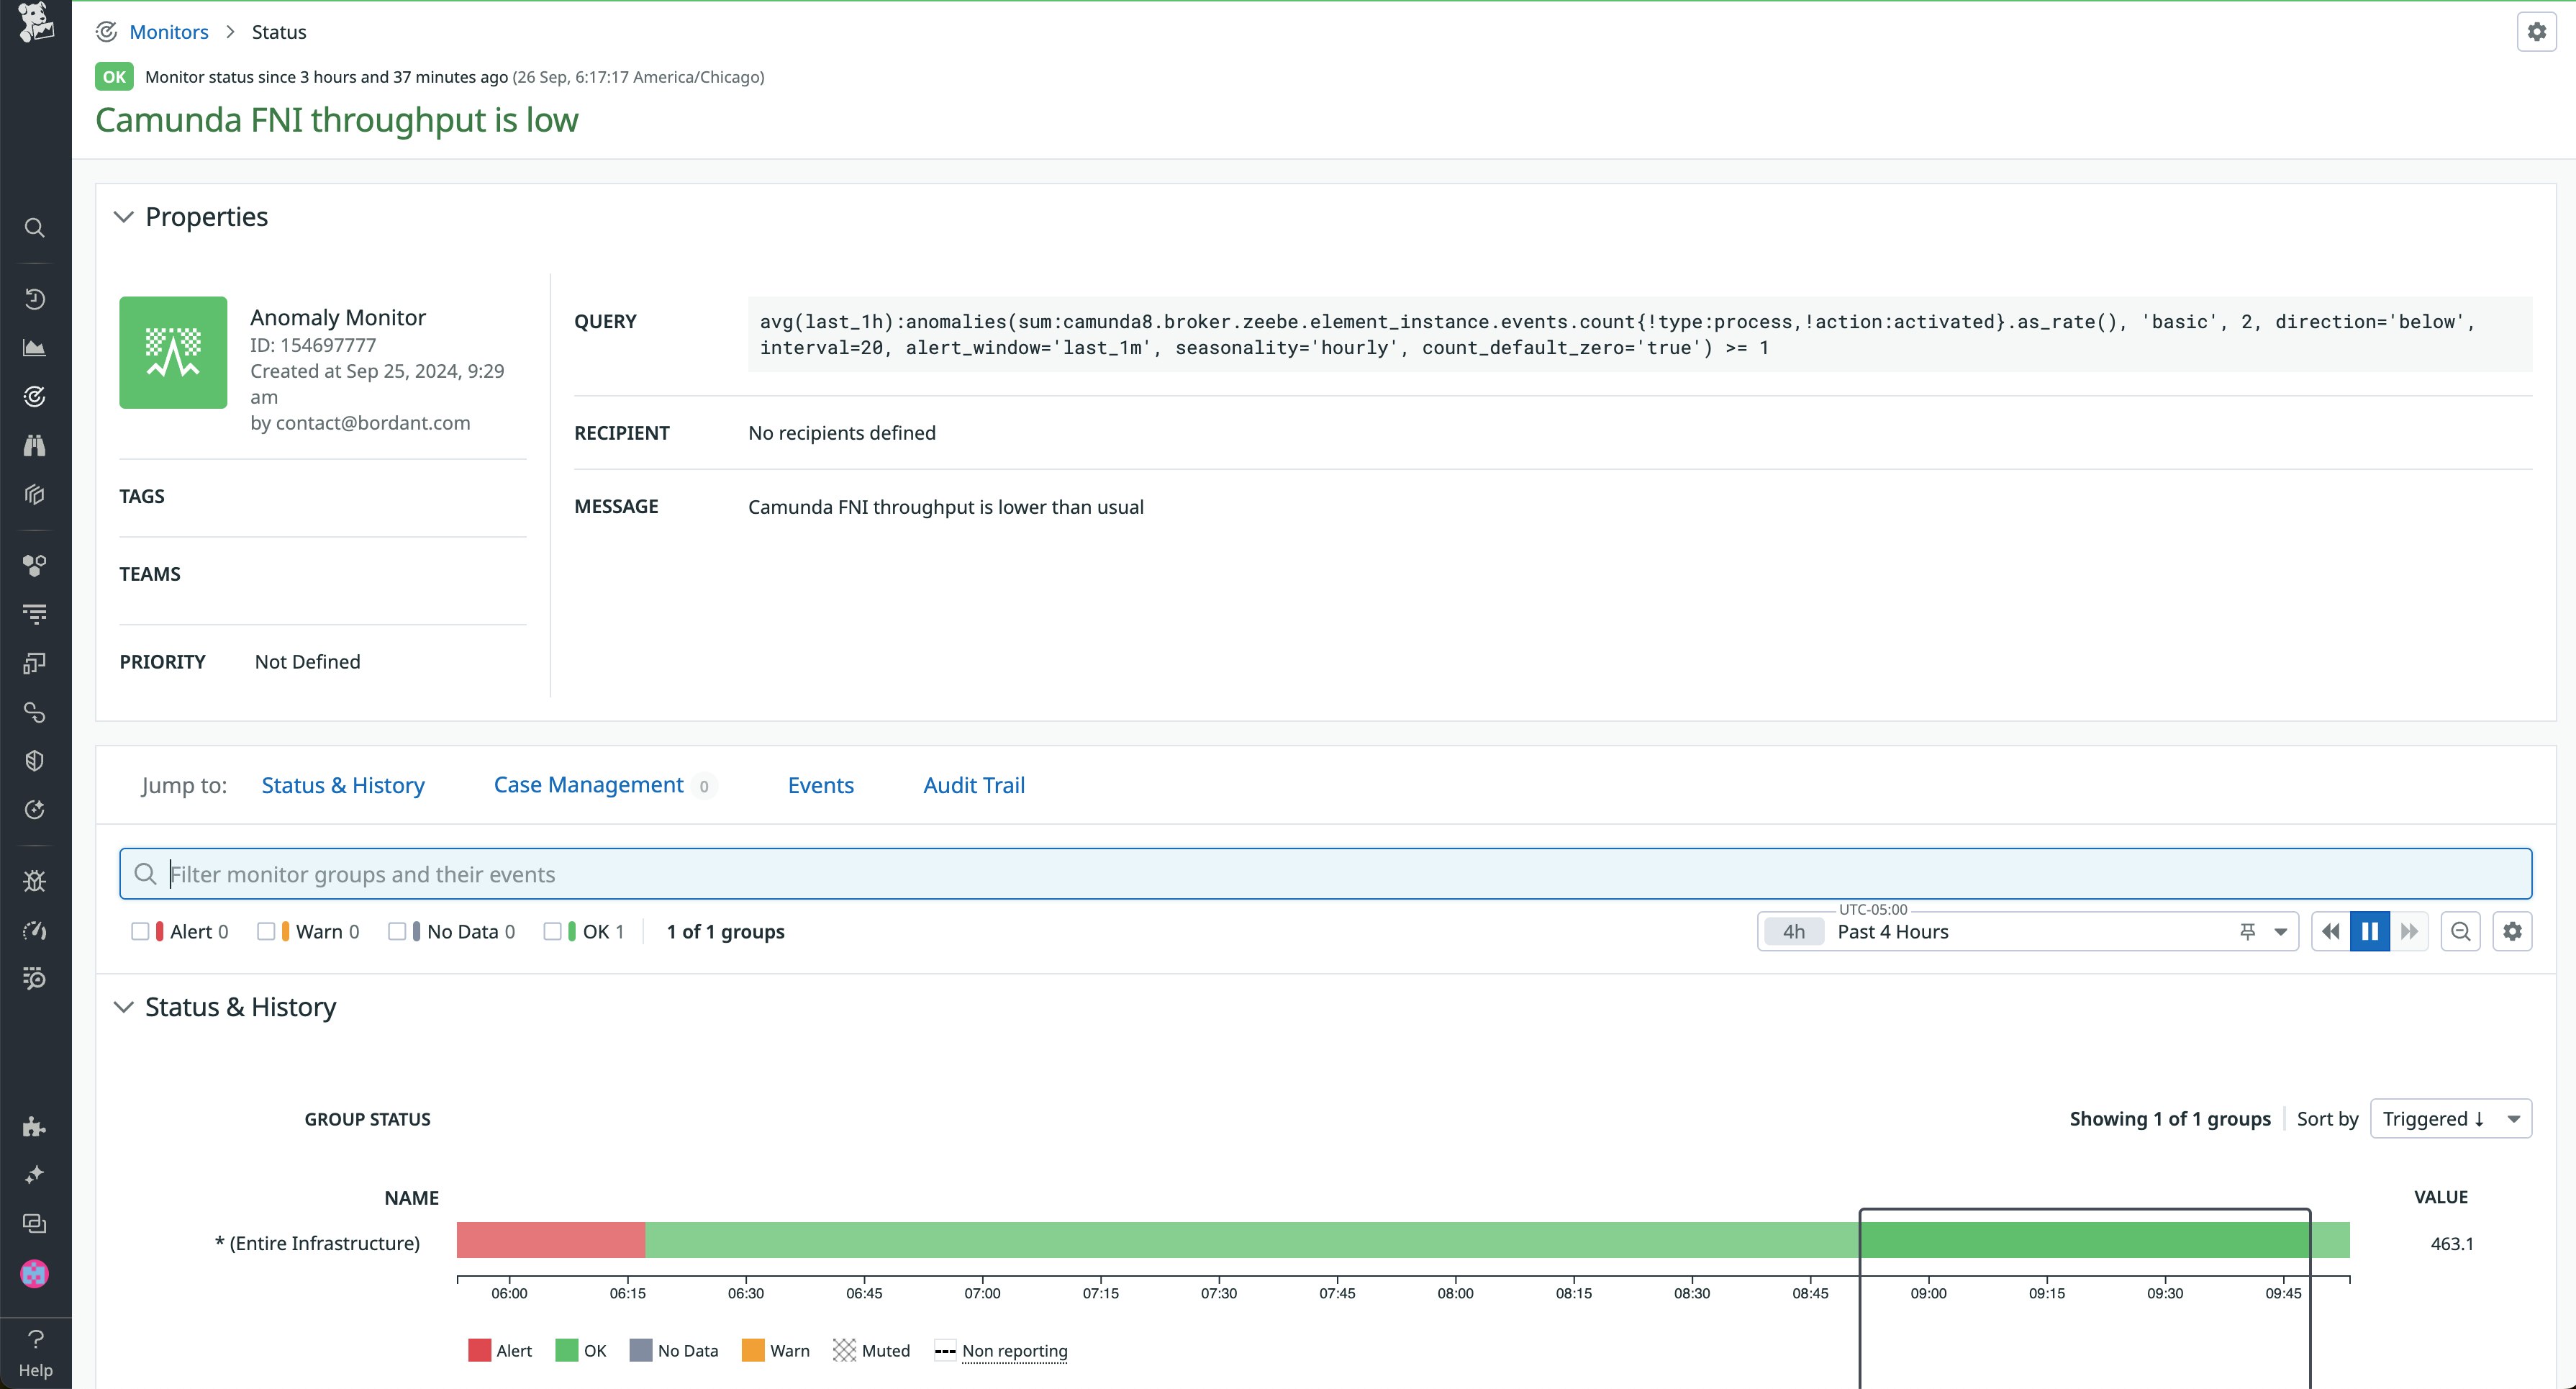
You can use Datadog to set alerts for Camunda 8 metrics and receive real-time notifications in case of an incident or performance issue. For example, you can configure alerts that notify you of any significant drops in throughput, allowing you to prevent unplanned downtime by resolving an issue before it impacts operations. In the case of the telecommunications company that we discussed above, setting up an anomaly detection alert on FNI throughput enables you to be notified early if resource provisioning for new customers is taking longer than expected.

The ability to customize alerts with Datadog monitors gives you control over Camunda 8 performance while strengthening the reliability of your entire system. You can set anomaly monitors that notify you anytime your Camunda 8 metrics deviate from baseline, or metric monitors that trigger anytime metric values exceed your configured alert threshold. In the event of an incident, you can pivot from an alert to Datadog Incident Management to help you initiate the incident response process, notify stakeholders, track status, document postmortem reviews, and more.
Start monitoring Camunda 8 in Datadog today
Bordant Technologies’ Datadog integration provides a holistic view of Camunda 8 performance, enhancing your ability to manage and optimize end-to-end process orchestration. The out-of-the-box Camunda 8 Overview dashboard provides increased visibility into your Camunda 8 platform to keep your components healthy and available, while customizing alerts equips you with the control you need for continuous uptime.
You can get started with a 14-day free trial of the Camunda 8 integration in the Datadog Marketplace. To learn more, visit our documentation. If you’re new to Datadog, sign up for a free trial today.
The ability to promote branded marketing tools is a membership benefit offered through the Datadog Partner Network. If you’re interested in developing an integration or application that you’d like to promote, you can apply to be a Datadog Technology Partner.


