Argo CD is a declarative continuous delivery tool for Kubernetes developed by the Cloud Native Computing Foundation (CNCF). Argo CD automates your application deployment by continuously monitoring the live state of your containers and comparing it against the desired state in your Kubernetes manifest files, then pulling changes into your Kubernetes clusters as needed. Because your cluster setup is sourced directly from the manifest files in your application’s repository, you can track any changes made to your container infrastructure via Git, making Argo CD GitOps-compatible. And with an easy-to-use interface, you can quickly check whether all your containers are in sync with your repository at any time.
The Datadog Argo CD integration helps you ensure that your Kubernetes cluster is up to date with your latest manifest files via metrics from every Argo CD component. By using the Argo CD out-of-the-box (OOTB) dashboard, you can monitor how quickly and accurately your infrastructure changes are being applied to your cluster. Plus, you can easily leverage preconfigured monitors for key Argo CD metrics to notify you of any sync issues. In this post, we’ll explain how the Argo CD integration can help you:
- Visualize activity across your Argo CD clusters
- Troubleshoot with metrics from every Argo CD component
- Quickly detect application sync issues with Argo CD monitors
Visualize activity across your Argo CD clusters
There are three main components to Argo CD: the repository server, application controller, and API server. Each component handles a different part of the sync process: the repository server maintains a local cache of your manifest file, the application controller compares the manifest file against the current state of your cluster to look for changes, and the API server provides endpoints for the deployments and rollbacks needed to reconcile these changes. To ensure your Argo CD clusters are able to stay in sync with your manifest file, you need to monitor all three components.
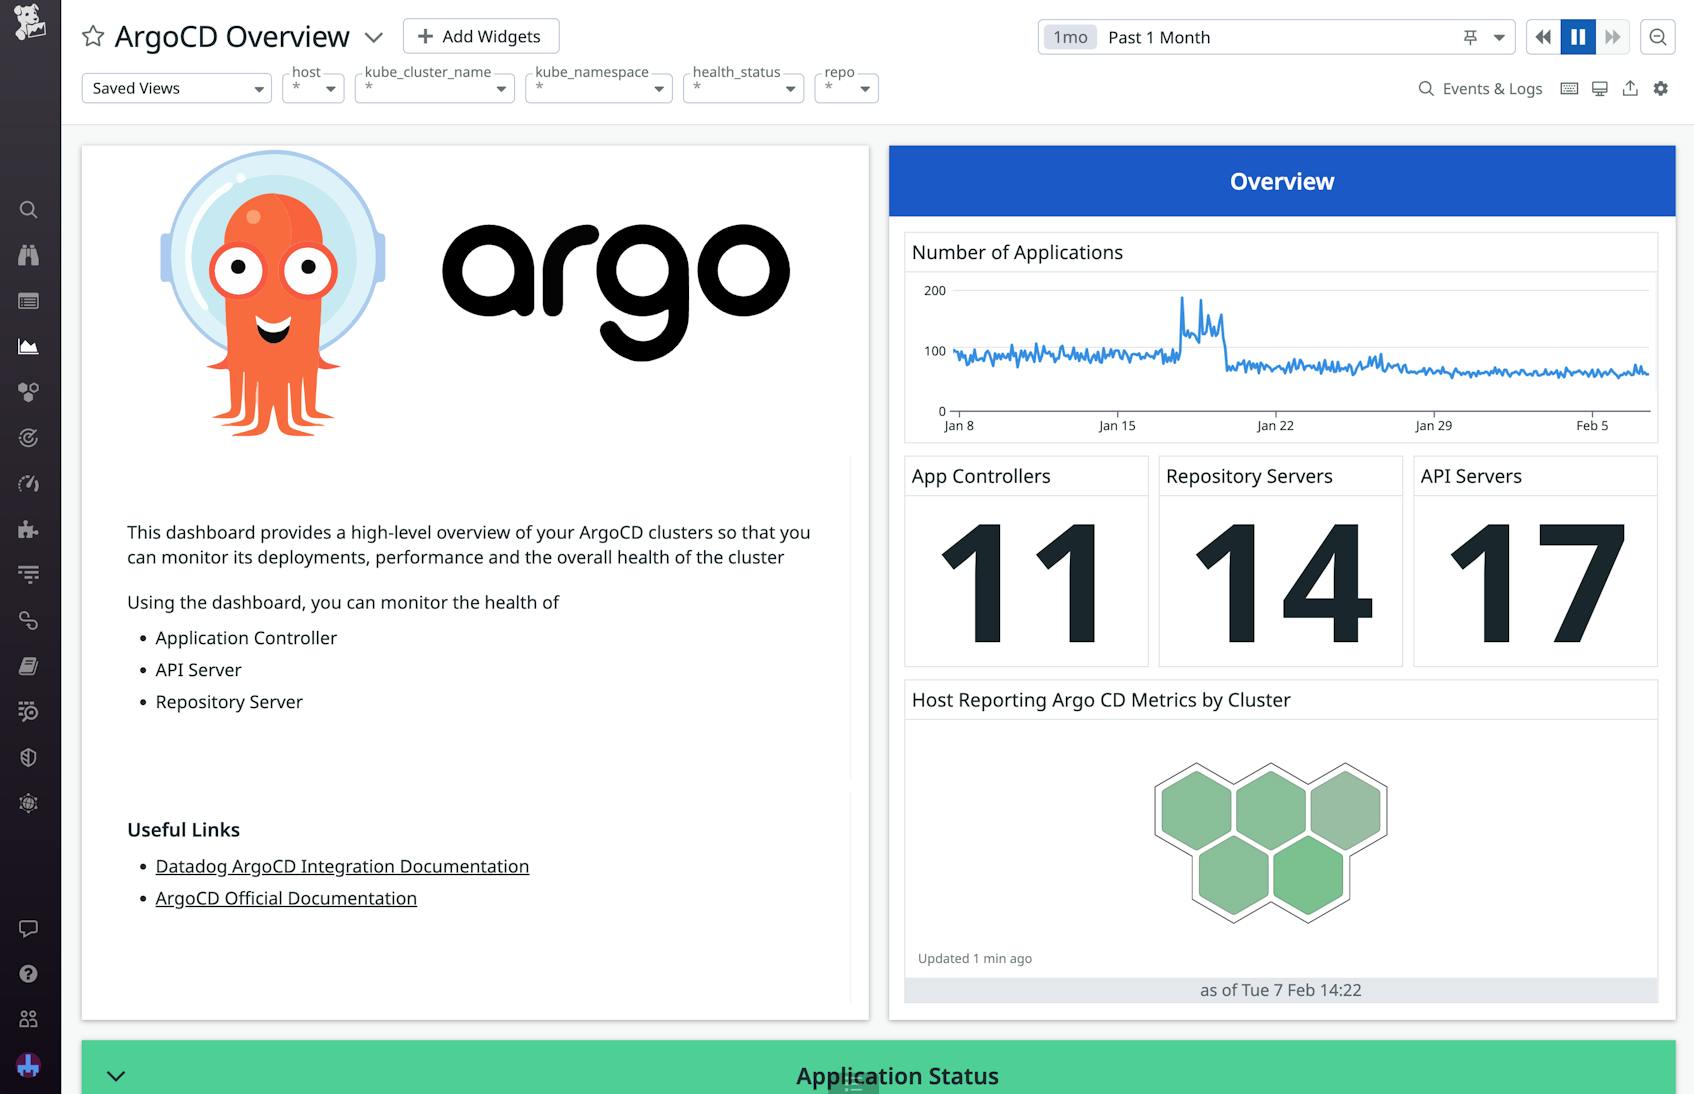
The Argo CD OOTB dashboard helps you visualize metrics for each component, allowing you to see how well Argo CD is managing your application deployments and syncs. You can access information such as how many app syncs are occurring and how many are successful or failing, giving you granular visibility into your container configuration. With this data, you can quickly spot any deployment issues that could be affecting your Kubernetes clusters and syncs. Some metrics on the dashboard that can give you insight into the state of your cluster include:
argocd.app_controller.app.sync.count: the total number of application syncsargocd.app_controller.app.info: how many applications are not in sync, categorized by host and statusargocd.api_server.grpc.server.handled.count: the total number of requests for each serviceargocd.repo_service.git.request.duration.seconds.bucket: the performance of Gitfetchrequests
In addition to performance data from the main three components, you can also access Argo CD logs, utilization metrics, and Kubernetes cluster stats to help you with troubleshooting. Additionally, the dashboard comes with template variables that help you easily drill down into specific cluster attributes, such as namespace, health status, and repository. You can use these attributes to narrow the scope of your investigation based on the hosts you want to target. For example, health status enables you to target hosts that are up to date, currently progressing through a sync, or whose status is missing or unknown.
Troubleshoot with metrics from every Argo CD component
You can also use the Argo CD dashboard to help you dig deeper into your incident investigations. Let’s say you receive an error while attempting to deploy a change to your Kubernetes configuration. You can pivot to the Argo CD dashboard to see whether there seem to be any sync issues in your cluster. Via the argocd.app_controller.app.info metric, you’re able to see that a high number of applications are not in sync.
This metric also shows you the specific hosts experiencing this issue. By jumping to the logs widget on the dashboard, you see a high number of error messages from these hosts with additional details about the issue, such as the relevant failure codes and the time that the hosts started failing. You can then view these hosts in Datadog Container Monitoring to pinpoint the problem, whether it’s syntax errors in the YAML manifest file or an overloaded resource.
Quickly detect application sync issues with Argo CD monitors
In order to catch issues in your Kubernetes deployments even faster, you can set up Argo CD monitors to notify you of sync issues. The Argo CD integration includes a recommended, preconfigured monitor that alerts you to any app sync failures by filtering the argocd.app_controller.app.info metric to unsuccessful syncs. It also includes a default sync failure threshold and 30-minute interval for sync status checks, so you can be notified as soon as it’s clear that there’s a meaningful issue without getting distracted by false alarms.
Let’s say your monitor alerts you to an out-of-sync cluster. By pivoting to the Argo CD dashboard, you can immediately see that the Argo CD API server has exceeded the amount of available CPU on its host, making it difficult to process new requests. You can then use the dashboard to investigate whether there’s an unusual spike in requests due to a one-off event or whether this is an ongoing issue indicating that you may need to allocate more resources to your servers.
Start monitoring Argo CD performance with Datadog today
Argo CD can help you easily manage your Kubernetes clusters while maintaining a single source of truth via Git. With the Datadog integration, you can quickly detect application sync failures that could cause your cluster configuration to drift from your application deployments. The OOTB dashboard enables you to visualize activity throughout your entire cluster, while the recommended Argo CD monitor helps you catch meaningful sync issues fast.
To get started, you can set up the Argo CD integration using our documentation. Or, if you’re not yet a customer, you can sign up for a 14-day free trial today.


