Aaron Kaplan

Lowell Abraham
Amazon MemoryDB for Redis is a highly durable in-memory database service that uses cross-availability-zone data storage and fast failover, providing microsecond read times and single-digit-millisecond write times. Datadog’s integration for MemoryDB uses a range of metrics to provide important visibility into MemoryDB performance. You can use the integration’s out-of-the-box (OOTB) dashboard alongside monitors to track these metrics in order to optimize performance and stay ahead of issues that might impact user experience or drive up costs.
In this post, we’ll cover using Datadog’s integration for Amazon MemoryDB to quickly gauge the health of your database and optimize MemoryDB performance by tracking host-level metrics for memory usage and network traffic.
Quickly gauge the health of your database
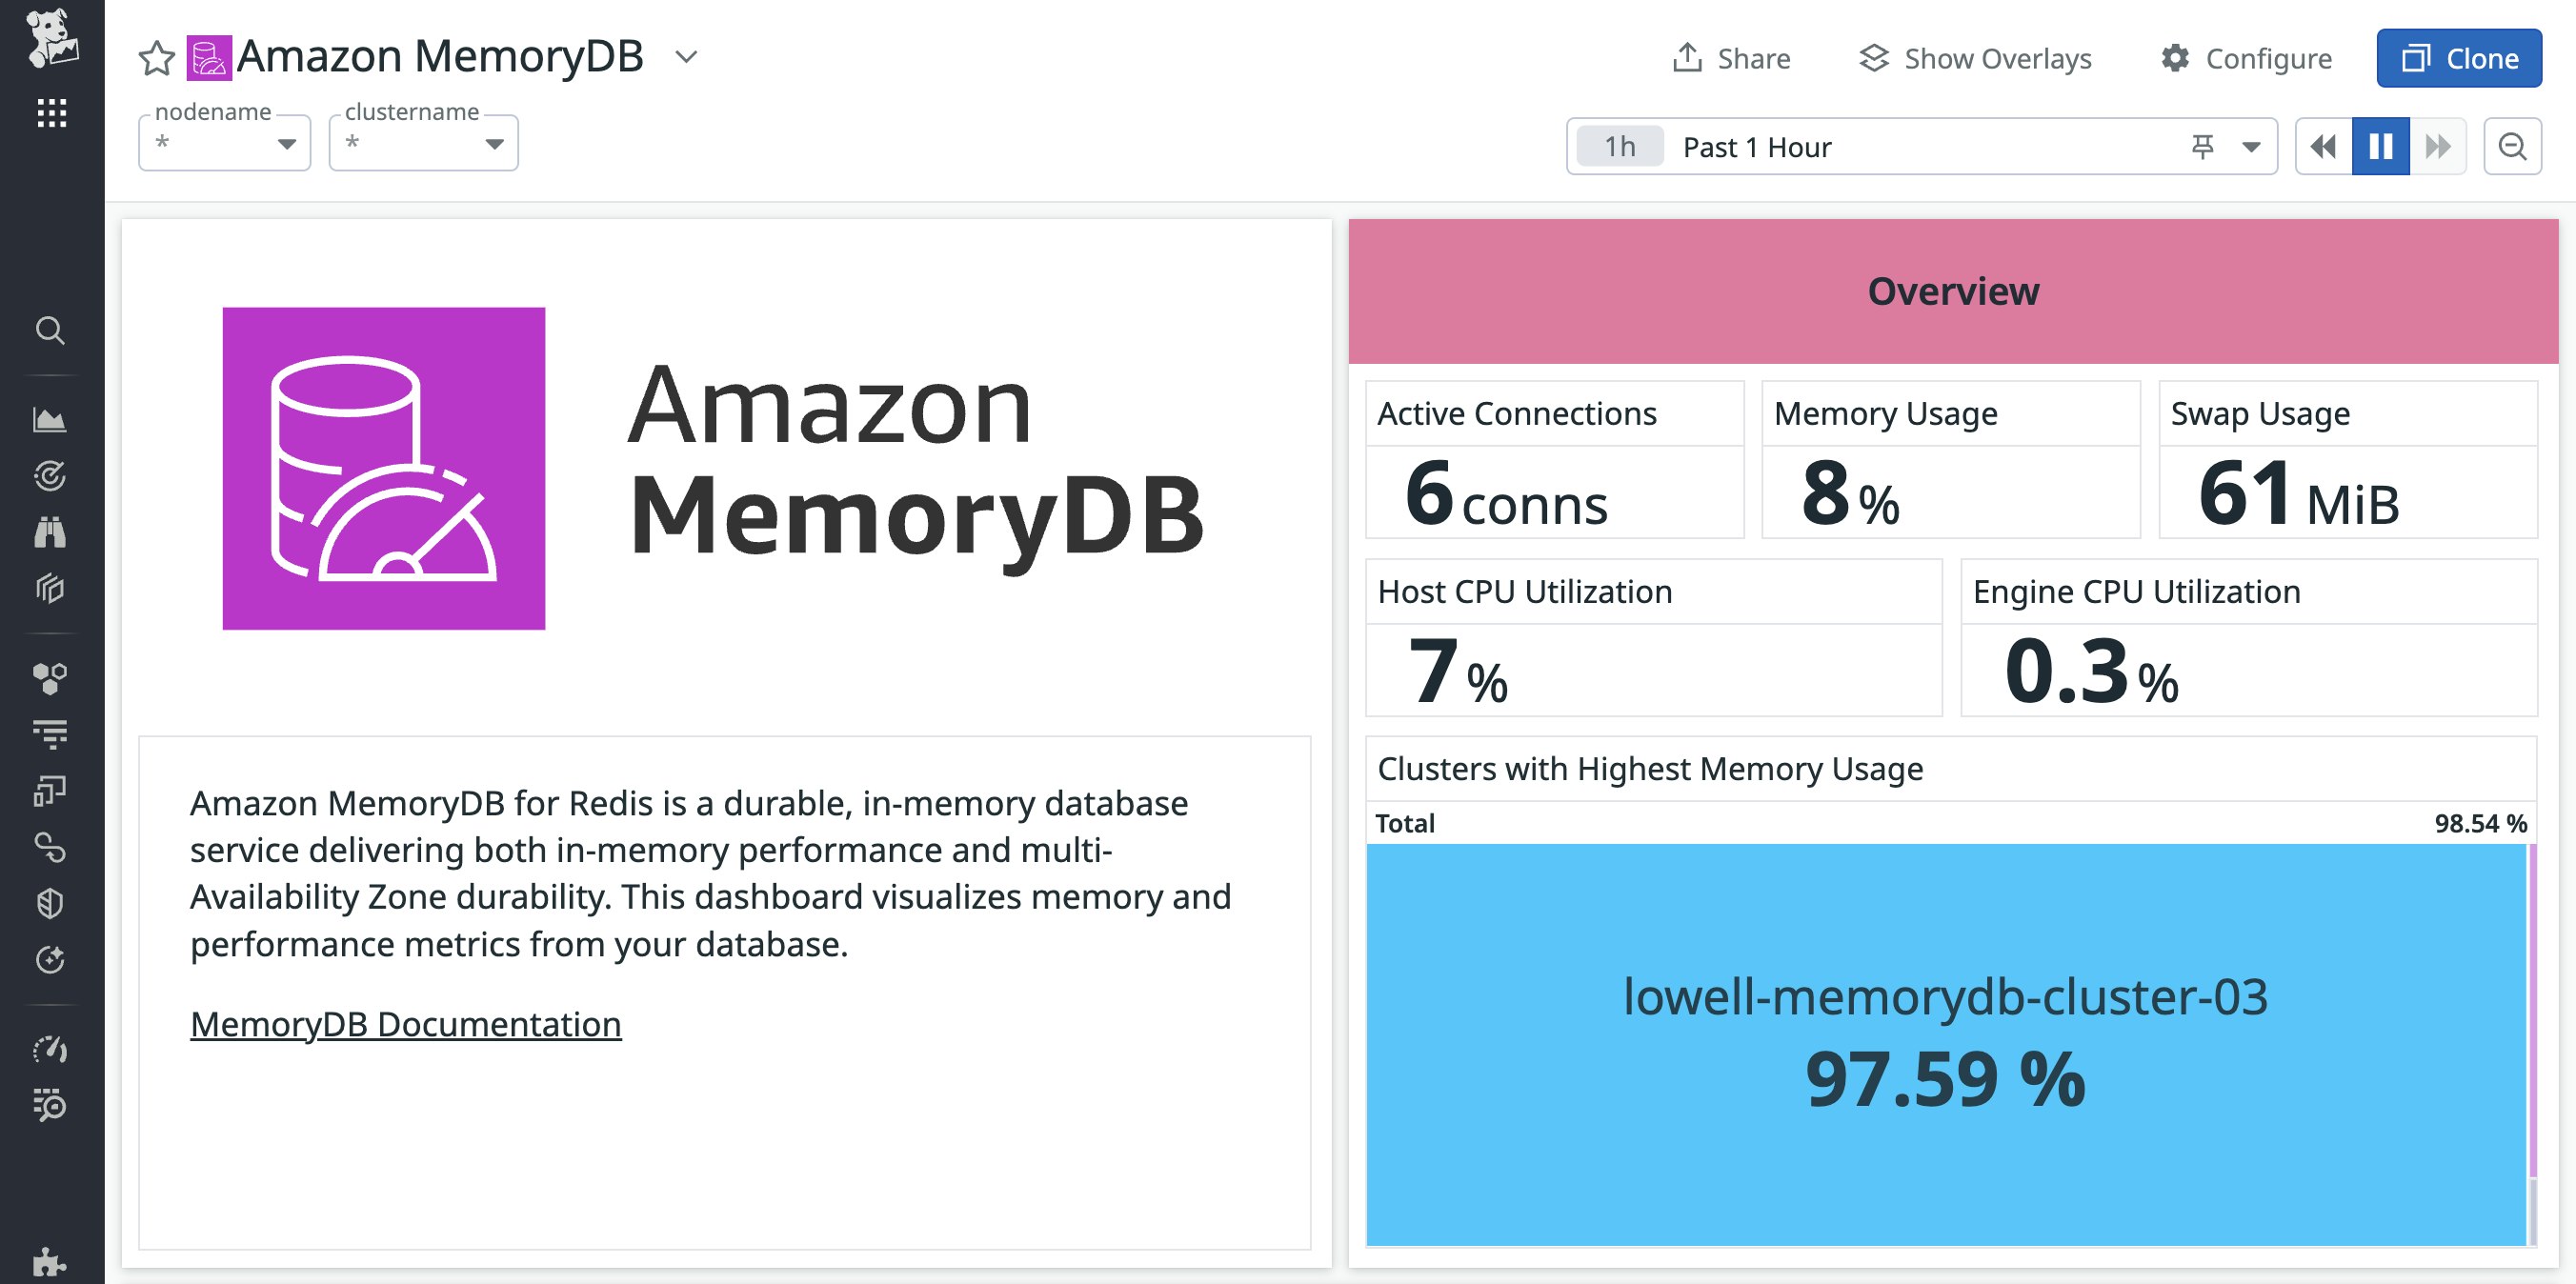
Once you’ve enabled the Amazon MemoryDB integration, you can access its OOTB dashboard for an in-depth look at the performance of your MemoryDB database. The overview section of the dashboard displays a selection of key cluster-level and Redis metrics to help you gauge the overall health and performance of your database at a glance:
- By monitoring the number of active connections to your database alongside overall memory usage, swap usage, host CPU utilization, and engine CPU utilization, you can understand your MemoryDB resource consumption and prevent it from getting out of hand, which could lead to performance issues and data loss.
- By breaking down the clusters with highest memory usage, you can quickly assess what’s driving your MemoryDB compute usage and troubleshoot excessive memory consumption.

To stay ahead of user-facing performance issues, you can configure monitors to alert on your active connections and compute usage metrics. The overview section of the dashboard also includes a breakdown of memory usage by cluster, which can help guide troubleshooting. For in-depth troubleshooting and performance insights, however, visibility into memory usage and network performance is key. Next, we’ll discuss how this integration provides that visibility through key host-level metrics.
Optimize MemoryDB performance by tracking host-level metrics
Tracking host-level metrics for MemoryDB is essential to ensuring a high level of performance in your database. The integration’s OOTB dashboard breaks down key Memory and Network Performance metrics from your hosts.
MemoryDB memory metrics
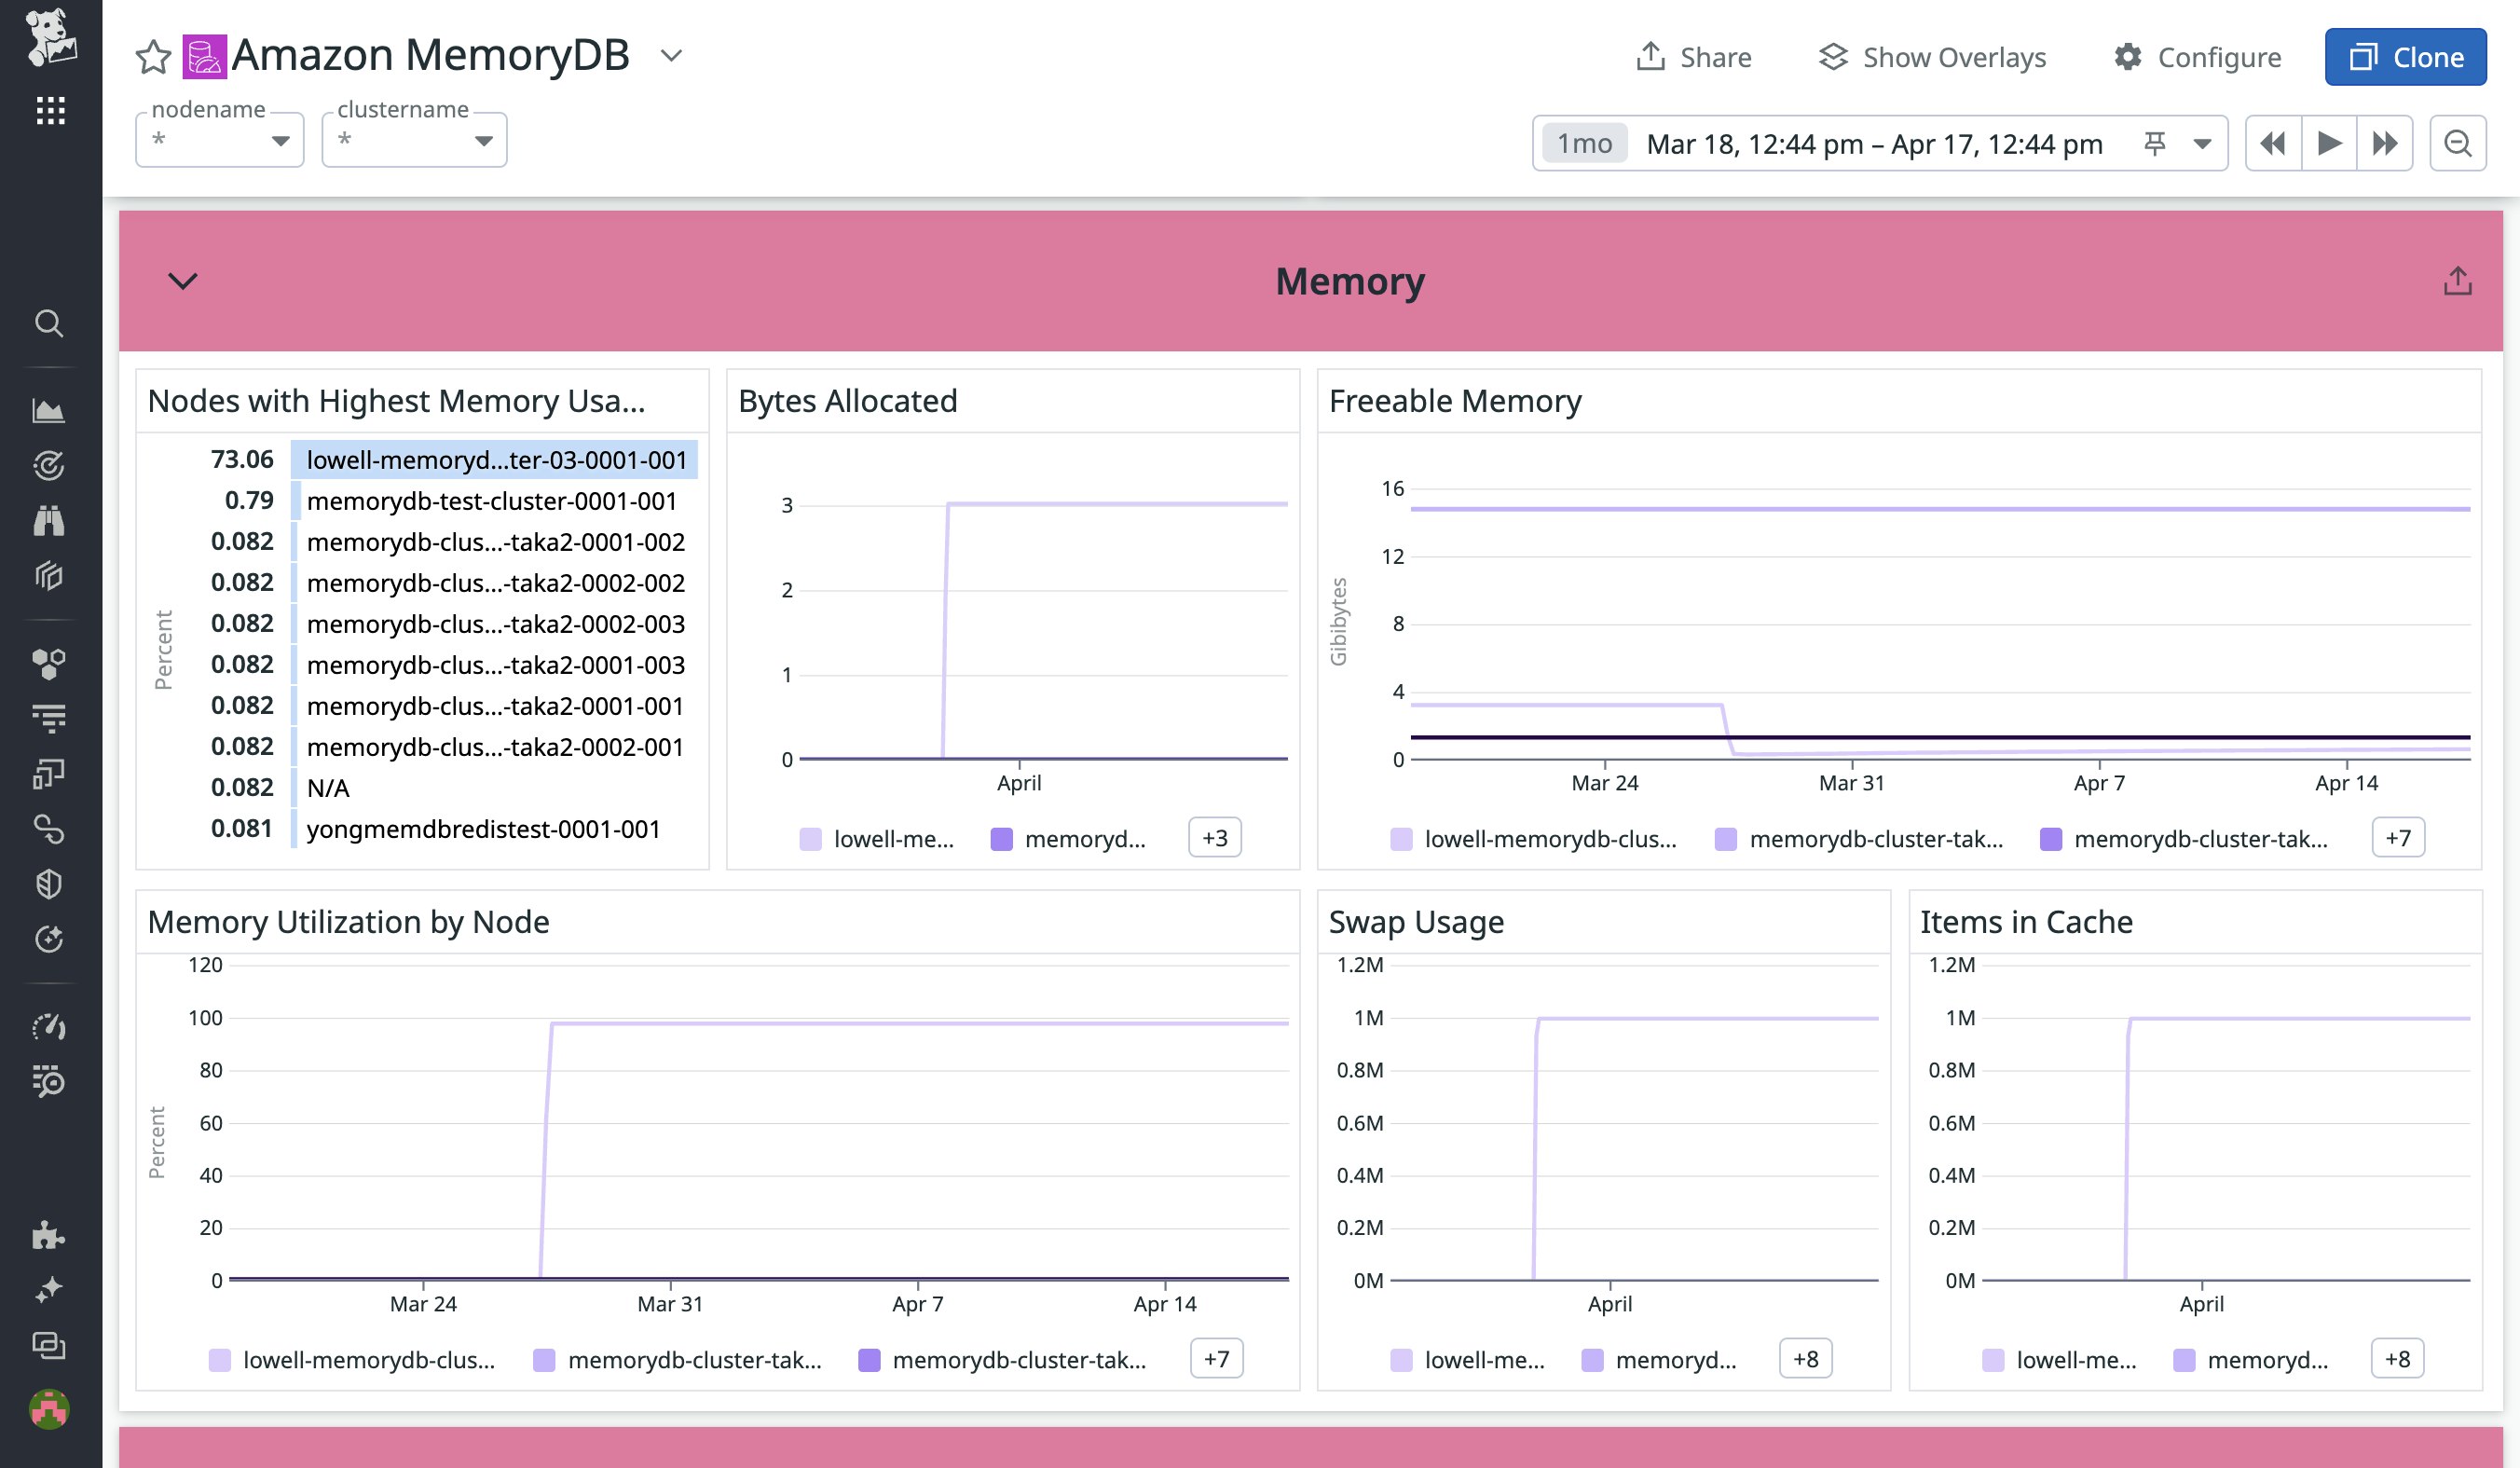
Monitoring memory usage is essential to maintaining a performant MemoryDB database. As datasets grow, tracking this usage can help you preempt user-facing issues and determine when and how to scale your resources. The Memory section of the integration’s OOTB dashboard visualizes several key metrics:
- By tracking the nodes with highest memory usage toplist and memory utilization by node over time, you can quickly determine which parts of your MemoryDB cluster are driving your memory usage.
- You can compare the bytes allocated (the amount of memory designated to each node) and freeable memory (the amount of memory each node has available) metrics to verify that you’re making the best use of your memory resources.
- Swap usage helps you monitor available swap memory. As per AWS guidelines, you should ensure that this metric does not exceed 50 MB to prevent performance issues.
- Tracking the items in cache for each of your nodes helps you track the growth of your database over time.

By monitoring and alerting on these metrics, you can understand your MemoryDB resource usage, plan scaling, and preempt database performance issues. Next, we’ll look at how you can understand these metrics in context and troubleshoot other types of performance issues by analyzing network metrics.
MemoryDB network performance metrics
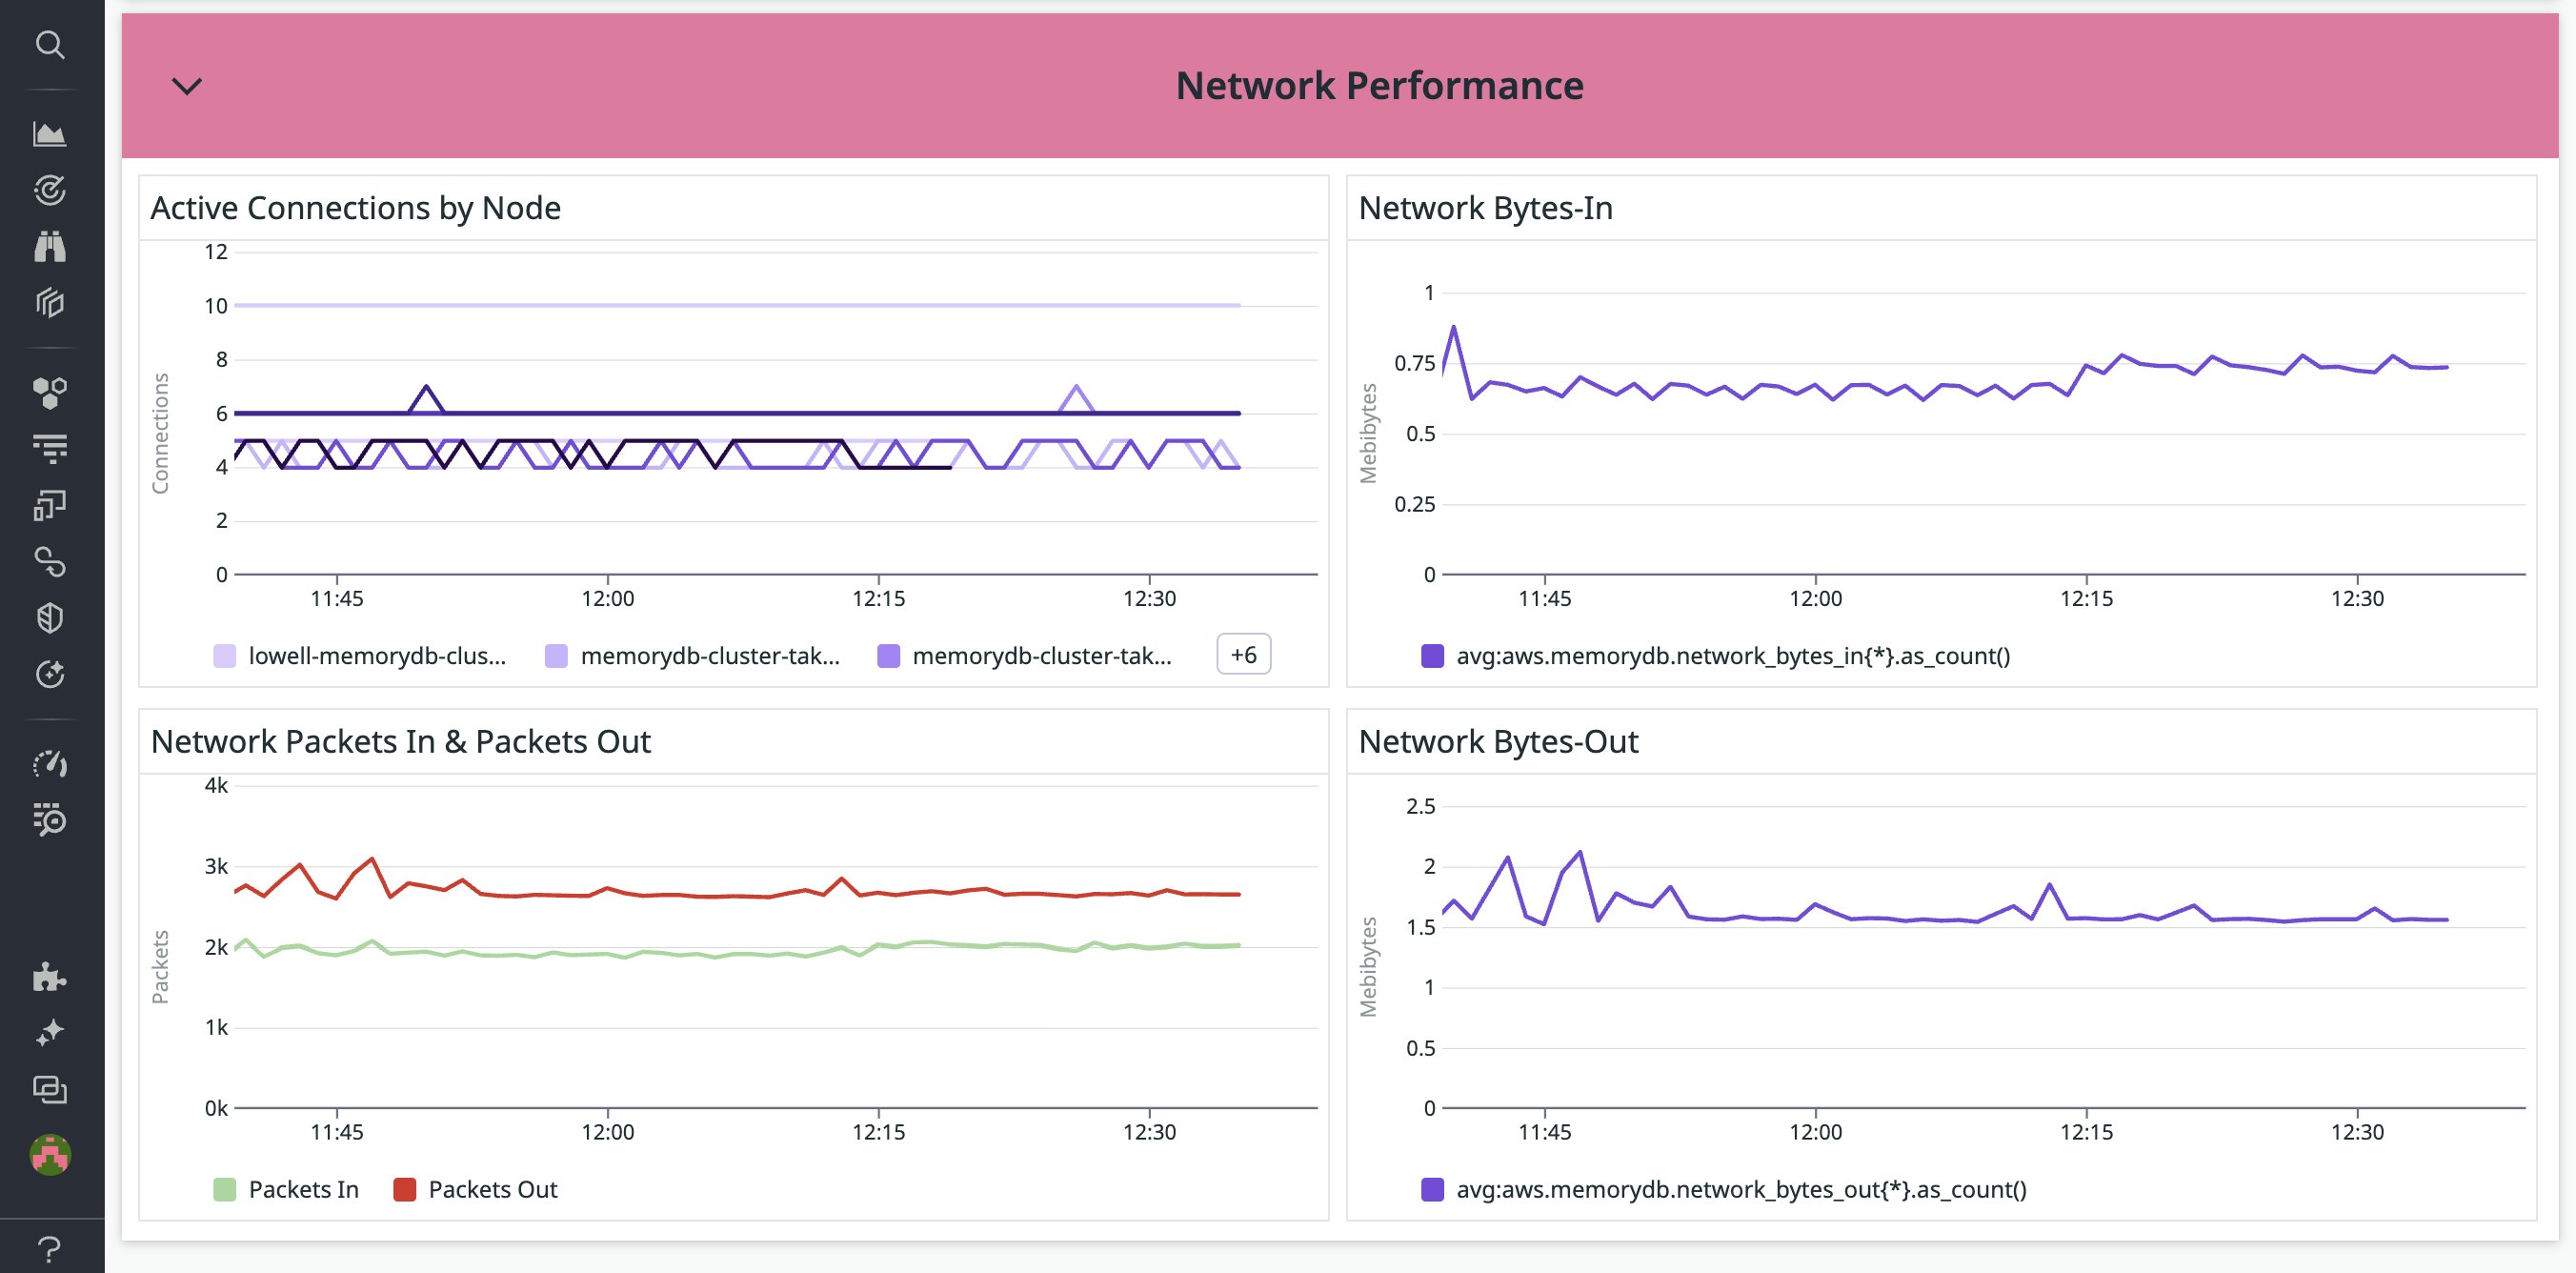
The Network Performance section of the integration’s OOTB dashboard visualizes five key metrics to provide an in-depth picture of MemoryDB network traffic and help you troubleshoot performance issues.
- You can use the active connections by node and network bytes-in metrics to analyze incoming traffic. For example, a spike in either of these metrics might threaten to drive up latencies, lead to unexpected costs, or overwhelm your MemoryDB resources.
- The network packets in, packets out, and bytes-out metrics can help you ensure that your database is serving data as expected. For example, an unexpected drop in bytes-out or a major divergence between packets in and packets out may indicate an issue with the network bandwidth of your cluster.

Gain key visibility into MemoryDB
Datadog’s integration for Amazon MemoryDB provides key insights into the performance of your MemoryDB database. By using the integration’s OOTB dashboard and alerting on essential metrics, you can preempt user-facing issues and optimize performance. Check out our documentation to get started and learn more. If you don’t already have a Datadog account, you can sign up for a 14-day free trial.


