Amazon Elastic Container Service (ECS) is an orchestration service for Docker containers running within the Amazon Web Services (AWS) cloud. You can declare the components of a container-based infrastructure, and ECS will deploy, maintain, and remove those components automatically. The resulting ECS cluster lends itself to a microservice architecture where containers are scaled and scheduled based on need.
ECS integrates with other AWS services, letting you, for example, route container traffic through Elastic Load Balancing or attach an Auto Scaling policy to your ECS deployment. And, with Fargate, you can deploy your containers straight to the AWS cloud, without needing to provision EC2 instances.
Much of ECS is built around automated deployments, and you’ll want to monitor your ECS infrastructure to make sure containers are launched, provisioned, and terminated as expected. You’ll also want to monitor the overall health and performance of your ECS containers and virtual machines. In this post, we’ll walk you through the metrics that can give you a clear picture of how ECS is running.
We have organized the metrics into two broad categories:
Resource metrics, both at the level of ECS abstractions (tasks, services, and clusters) and at the level of containers and EC2 instances
Metrics that track the current status of ECS tasks and services
ECS works with a toolbox of services, task definitions, launch types, and (in some cases) container instances. Below, we’ll explain these concepts in more detail before surveying the most important ECS metrics to monitor.
Components of an ECS cluster
Declaring containers with tasks
The building blocks of ECS deployments are called tasks. A task executes instructions for launching, terminating, and configuring containers, and listens for the status of its containers as well as instructions from ECS.
A task definition is a JSON object that you register with ECS. It specifies the same sorts of configuration options you’d set in a Dockerfile or a docker run command, including which Docker images you’ll use for the containers, the extent to which each container will use system resources, and which command a container will run on startup. When creating task definitions, you can name Docker images from any container registry, whether it’s Amazon’s Elastic Container Registry (ECR), Docker Hub, or another registry of your choice, including your own.
You can update a task definition to name a newer version of a container image, allocate more resources, or otherwise re-configure certain options. When you update a task definition, you’ll see a new version of the task definition listed in the ECS console, and can select one version or another to launch—if you need to roll back an update, you can simply change any services that specify a task definition to use an earlier version.
The following task definition declares one container for a Flask application and another for Redis. We’ll explain some of these parameters later on (parameters with empty values have been removed for clarity):
{
"containerDefinitions": [
{
    "compatibilities": [
        "EC2",
        "FARGATE"
    ],
    "containerDefinitions": [
        {
            "cpu": 85,
            "entryPoint": [
                "python",
                "app.py"
            ],
            "essential": true,
            "image": "my-flask-app",
            "name": "app",
            "portMappings": [
                {
                    "containerPort": 4999,
                    "hostPort": 4999,
                    "protocol": "tcp"
                }
            ]
        },
        {
            "cpu": 85,
            "essential": true,
            "image": "redis:latest",
            "name": "redis",
            "portMappings": [
                {
                    "containerPort": 6379,
                    "hostPort": 6379,
                    "protocol": "tcp"
                }
            ]
        }
    ],
    "cpu": "256",
    "memory": "512",
    "networkMode": "awsvpc",
    "requiresCompatibilities": [
        "FARGATE"
    ],
    "revision": 28,
    "status": "ACTIVE"
}
After defining a task, you can create a service to schedule it automatically. Tasks pass through a three-stage lifecycle from PENDING to RUNNING to STOPPED. A service listens for the status of a task, and launches and terminates containers in response. Each service is assigned a single task definition, and you can specify the number of tasks a service will deploy from that definition and attempt to keep running. This makes it possible to scale your tasks horizontally to improve availability and performance.
As with other orchestration technologies, like Kubernetes deployments, ECS allows you to scale your service in a declarative way, meaning that if a service specifies three desired instances of a task, and only two are RUNNING, the service will launch the remaining task. Running a service is not the only way to execute tasks—it’s also possible to run them manually (with the AWS CLI, API, or console), based on CloudWatch Events, or with bespoke or third-party scheduling software. You can run tasks programmatically—but with an imperative approach—by using the AWS Cloud Development Kit (in preview at the time of publication), which lets you represent AWS resources as code and interact with AWS CloudFormation.
An ECS cluster is a group of tasks, services, and (in some cases) container instances. A cluster is designed for logical coherence, rather than network or resource isolation: a container in one ECS cluster can communicate with those in another, depending on your network configuration. All services and tasks belong to a cluster, and you can reuse task definitions between clusters.
ECS cluster infrastructure
The answer to the question, “What’s going on with my ECS infrastructure?” has two levels. One takes the form of task definitions, tasks, and services—specifications of containers and the logic of scheduling and scaling them. The second, which is just as important, refers to the compute resources on which ECS runs.
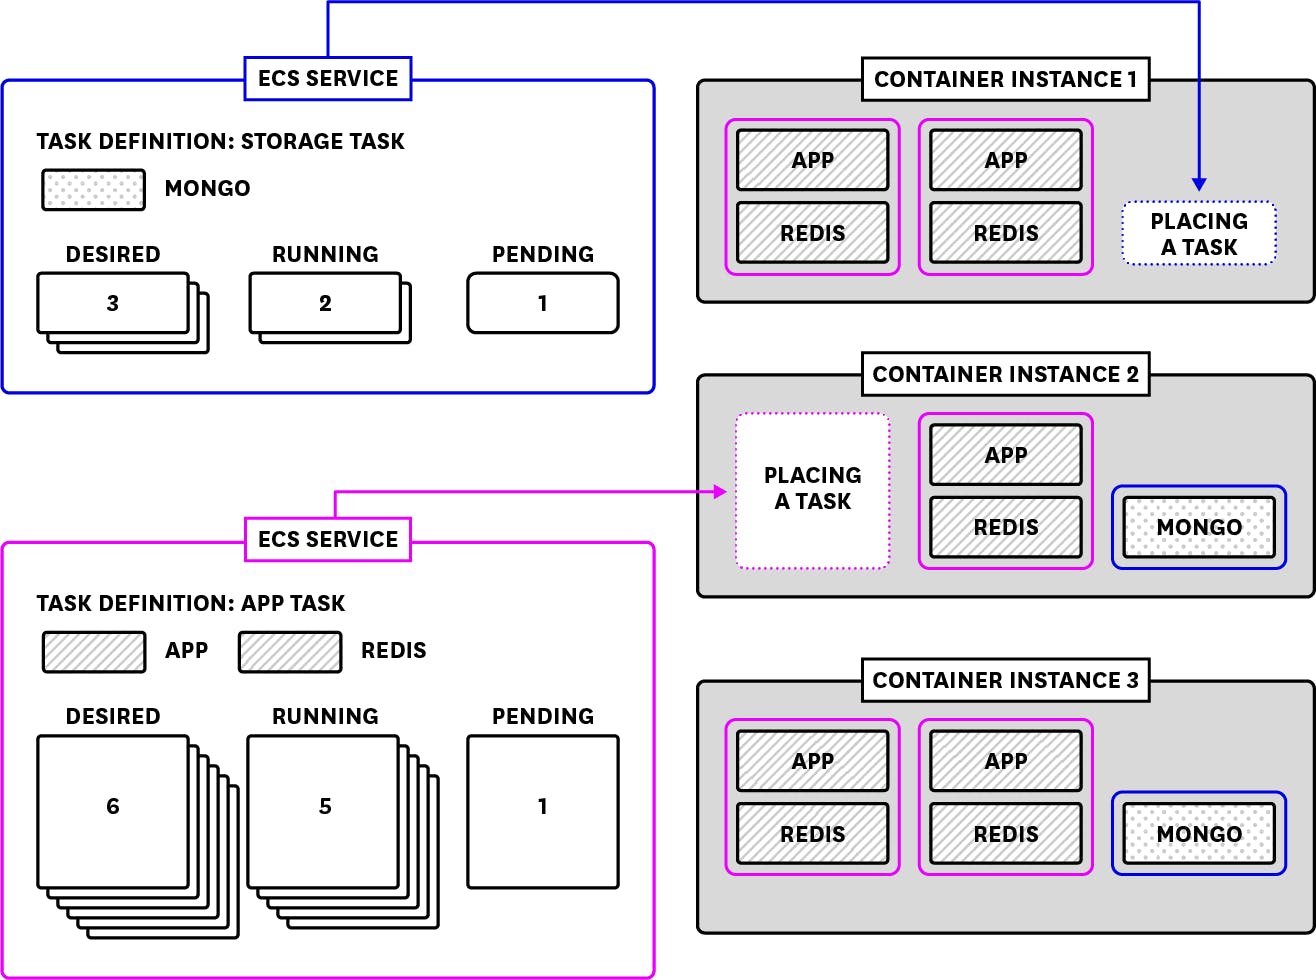
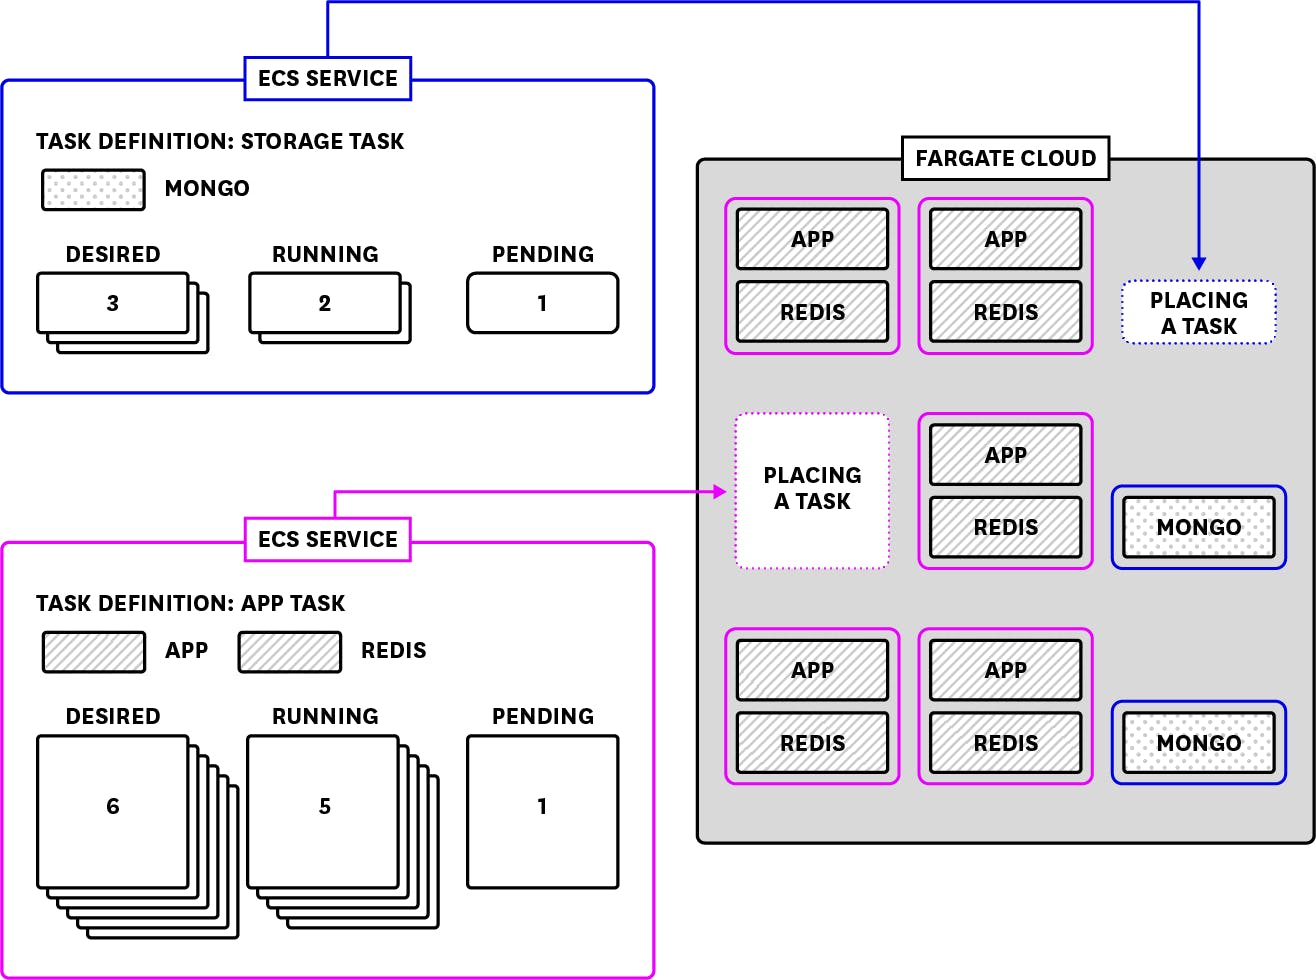
You can deploy containers by using one of two launch types: Amazon EC2 or Fargate. The EC2 launch type hosts ECS containers on EC2 instances (as shown in the diagram above). With Fargate, ECS abstracts away the VMs, letting you focus only on ECS services, tasks, and task definitions (as you can see below).
If you’re using the EC2 launch type, containers are deployed to virtual machines called container instances. A container instance is a standard EC2 instance that meets two conditions: it is registered within a cluster and runs the ECS Container Agent. You can register new EC2 instances within an ECS cluster either at the time you create the cluster or the time you launch the instances.
The ECS Container Agent running on each container instance (or, with Fargate, in the AWS cloud) obtains the desired status of tasks and services from the ECS API, and manages locally running containers in response (e.g., launching and terminating containers, and removing unused images).
AWS maintains a set of Amazon Machine Images (AMI) that are optimized for ECS and include a pre-installed version of the Container Agent. If you’re creating an instance from another AMI, you can install the Container Agent manually. If you’re using the Fargate launch type, the Container Agent runs on infrastructure that AWS manages.
You can create an ECS cluster within the browser-based ECS console as well as the ECS CLI. You’ll have the option to deploy EC2 instances, specifying the number to launch as well as their instance type, which determines the amount of resources available to each instance. And if your EC2 container instances need persistent data storage, you can choose to provision an Elastic Block Store (EBS) volume.
Monitoring in layers
ECS poses two challenges for monitoring. First, you’ll want to understand the health and performance of the infrastructure running your ECS applications, so you can define the appropriate tasks and services and ensure the availability of your ECS deployment. Second, since ECS operates according to the numbers and statuses of tasks, it becomes just as important to monitor application-level ECS abstractions. In this post, we’ll discuss two groups of metrics that provide comprehensive visibility across every layer of your ECS infrastructure:
ECS reports resource metrics in terms of reservation and utilization, and at the scope of the cluster or service. We’ll explain the options for configuring resource use in ECS, as well as the way ECS calculates reservation and utilization. Then we’ll explore individual metrics in more detail.
Managing resources in ECS
Configuring ECS resource limits
In ECS, you can use task definitions to reserve CPU and memory for entire tasks and/or individual containers. Some parameters are required, while some are optional. The tables below summarize these rules. You can find more information about each parameter in the ECS task definition reference.
Task-level resource parameters
Some parameters are scoped to the task as a whole, rather than a specific container belonging to the task.
| Resource | Task definition JSON property | Required | OS availability |
|---|---|---|---|
| CPU | .cpu | Only in Fargate | Linux only |
| Memory | .memory | Only in Fargate | Linux only |
Container-level resource parameters
A task definition can also specify resource limits for the memory and CPU utilization of individual containers. Some parameters define impassable (“hard”) limits, while others define “soft” limits that can be ignored if resources are available. For example, the memory parameter always defines a hard limit, and ECS will terminate any container that crosses it, while the memoryReservation parameter always defines a soft limit.
| Resource | Task definition JSON property | Required | Firmness (EC2) | Firmness (Fargate) | OS availability |
|---|---|---|---|---|---|
| CPU | .containerDefinitions[<INDEX>].cpu | Not required; if not provided, ECS will reserve a default number of CPU units | hard on Windows, soft on Linux | soft | Windows and Linux |
| Memory | .containerDefinitions[<INDEX>].memory | Only in EC2, where you must specify memory, memoryReservation, or both | hard | hard | Windows and Linux |
| Memory | .containerDefinitions[<INDEX>].memoryReservation | Only in EC2, where you must specify memoryReservation, memory, or both | soft | soft | Windows and Linux |
How ECS calculates resource metrics
ECS reports two kinds of metrics to describe the resource footprint of clusters and services: reservation and utilization. The first measures the percentage of CPU or memory available within the container instances in an ECS cluster, that you’ve reserved within your task definitions. The second measures the percentage of resources available to an ECS cluster or service that your deployment is actually consuming.
Reservation
Regardless of which launch type you’re using, you can configure ECS task definitions to reserve CPU and memory resources for entire tasks and individual containers, as described above. The Fargate launch type requires you to reserve task-level resources by naming specific combinations of CPU and memory. For the EC2 launch type, reserving resources for tasks is optional, and you’re not restricted to specific values.
ECS only reports reservation metrics at the cluster level, indicating the extent to which the total resource capacity of a cluster’s EC2 container instances is given over to ECS-related processes. Every minute, ECS sums the amount of CPU and memory reserved for tasks running within your ECS cluster, and divides this by the total CPU and memory available to the cluster’s container instances (based on their EC2 instance types). As such, reservation metrics are only calculated for clusters that use the EC2 launch type.
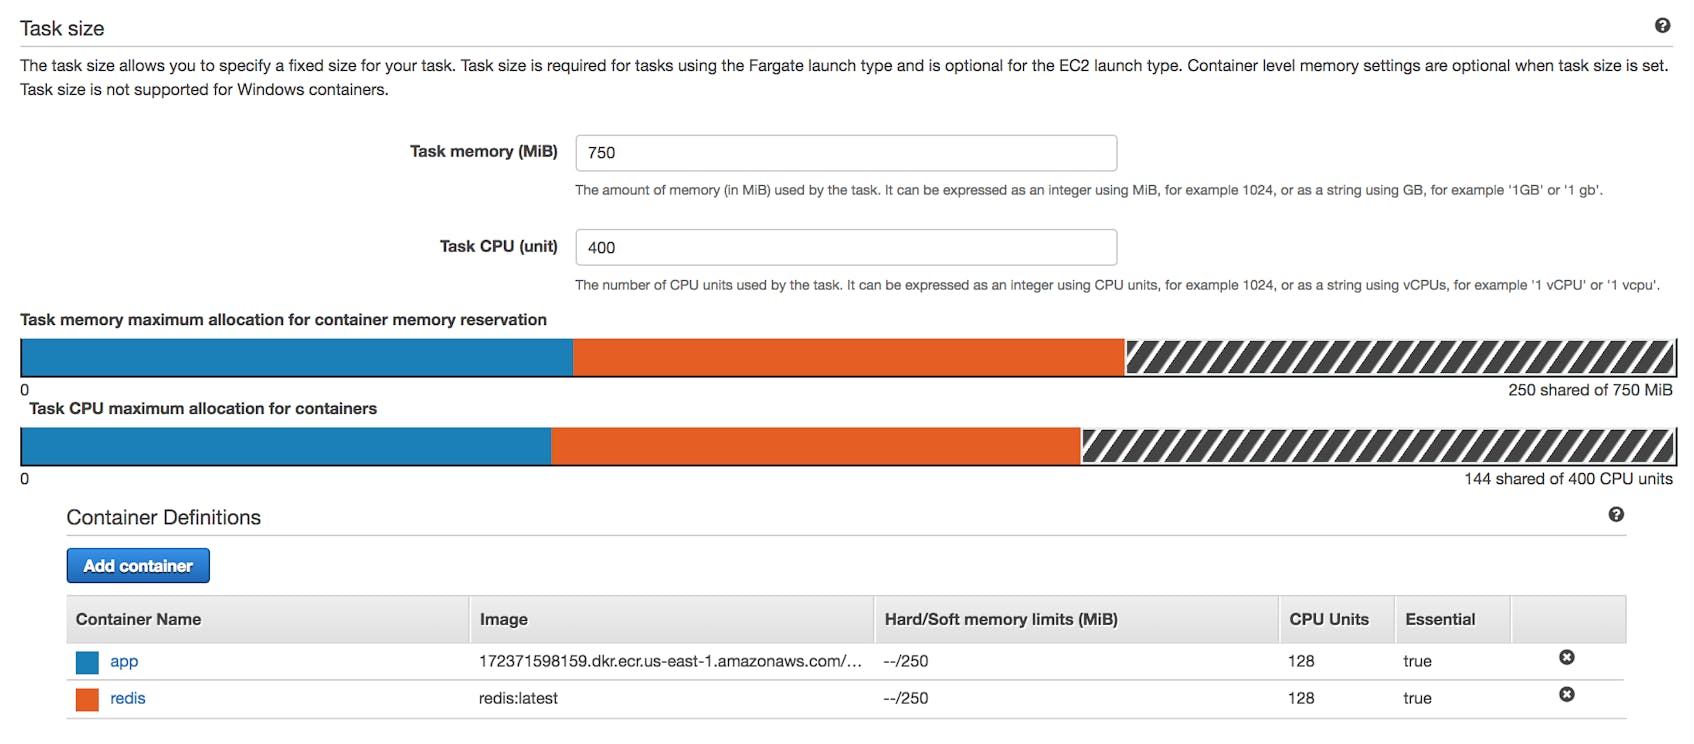
If the amount of a resource you’ve reserved for a task exceeds what you’ve reserved for the containers within that task, those containers will share the excess (as shown when creating a task definition in the ECS console above).
It’s worth noting that resources reserved at the container level are included within the sum reserved for a task. In an ECS cluster with a single task, if you reserve 250 MiB for each of the two containers within the task definition, and 600 MiB at the level of the task, the sum used to calculate MemoryReservation will be 600 MiB. Also note that CloudWatch calculates reservation metrics based only on tasks that are running.
Utilization
The way ECS calculates utilization metrics depends on whether they’re reported from a cluster or a service. Cluster utilization metrics represent the percentage of available resources (calculated based on instance type just as it is for reservation metrics) currently being used by tasks in the ECS cluster.
The formula changes when calculating service utilization metrics—ECS tallies the total CPU or memory used by tasks within a particular service, then divides that sum by the total CPU and memory reserved in the service’s task definition.
As you’ll see, configuring ECS for optimal performance requires paying attention to these and other resource metrics. This is important not only to avoid depleting or competing for a resource, but also because you can use these metrics to create effective Auto Scaling policies for your ECS services.
Key ECS resource metrics to monitor
It’s often a good idea to monitor the infrastructure on which ECS runs, not least because some bread-and-butter resource metrics, like network and I/O utilization, aren’t reported by ECS, so you’ll have to access them directly from your containers or container instances. For more detail, refer to our guides to monitoring EC2 and Docker. In this post, we’ll look at some key resource metrics for ECS, EC2, and Docker.
You’ll want to monitor the following resources in your ECS clusters:
CPU metrics
If you’re using the EC2 launch type, you’ll want to monitor your container instances’ resource consumption just as you would for any EC2 deployment. And for both launch types, you may want to monitor CPU metrics by Docker container or ECS service.
ECS reports CPU utilization and reservation metrics as a ratio of CPU units, multiplied by 100 to yield a percentage. A CPU unit is an absolute measure of an instance’s CPU capacity, regardless of the underlying hardware.
| Name | Description | Metric Type | Availability |
|---|---|---|---|
| CPUReservation (ECS) | Percentage of all CPU units reserved for a cluster that belong to ECS tasks (per ECS cluster*) | Resource: Other | CloudWatch |
| CPUUtilization (ECS) | Percentage of all reserved CPU units that running tasks are currently using (per ECS cluster* or service) | Resource: Utilization | CloudWatch |
| CPU utilization (EC2) | Percentage of CPU units currently in use (per EC2 instance*) | Resource: Utilization | CloudWatch |
| CPU utilization (Docker) | Percentage of time container processes are using the CPU (per Docker container) | Resource: Utilization | Docker-specific methods (pseudo-files, stats command, and local API) |
| * only for the EC2 launch type |
Metrics to watch
CPUReservation (ECS)
As your tasks run through their lifecycles, you’ll want to see how your CPUReservation changes over time, what its peaks and valleys are, and when your ECS cluster reaches them. If you’re using the EC2 launch type, you’ll want to monitor this metric alongside the CPUUtilization of your instances themselves. This is especially important if a service is running the task as part of a replica scheduling strategy, which attempts to run a certain number of tasks in your cluster. By default, a replica scheduling strategy distributes tasks evenly across availability zones, and only to container instances with sufficient resources. (It’s also possible to configure your own placement strategy.) If your tasks aren’t deploying as expected, they may be reserving more CPU time than is available on your EC2 instances.
CPUUtilization (ECS)
CPUUtilization is a right-size metric for scaling your services and clusters. If cluster-level CPU utilization is approaching 100 percent, you might consider adding more container instances. Stopping tasks could be a short-term solution, especially if a single task is responsible for the spike (e.g., as a result of a bug in your application code). If CPUUtilization is nearing capacity within the scope of a single service, you might consider updating that service to include more tasks, and (if applicable) scale your EC2 instances to accommodate this larger deployment.
At the service level, you might see CPUUtilization metrics exceeding 100 percent in a Linux environment, where container-level CPU limits are soft, and containers that have met their CPUReservation limit can use more CPU if it’s available.
CPU utilization (EC2)
For tasks deployed with the EC2 launch type, the ECS CPUReservation metric tells you how much of an ECS cluster’s CPU resources belong to ECS. Instance-level CPU metrics, on the other hand, can show you at a more useful granularity how your cluster-level CPUUtilization is distributed per container instance, making it clear how much CPU remains available for launching new tasks. By tracking instance-level metrics over time, you can determine whether periodic changes in demand could interfere with your services’ scheduling strategies (since ECS won’t place tasks on instances without sufficient resources). Monitoring instance-level CPU can make it easier to anticipate your resource capacity for scaling your ECS clusters.
CPU utilization (Docker)
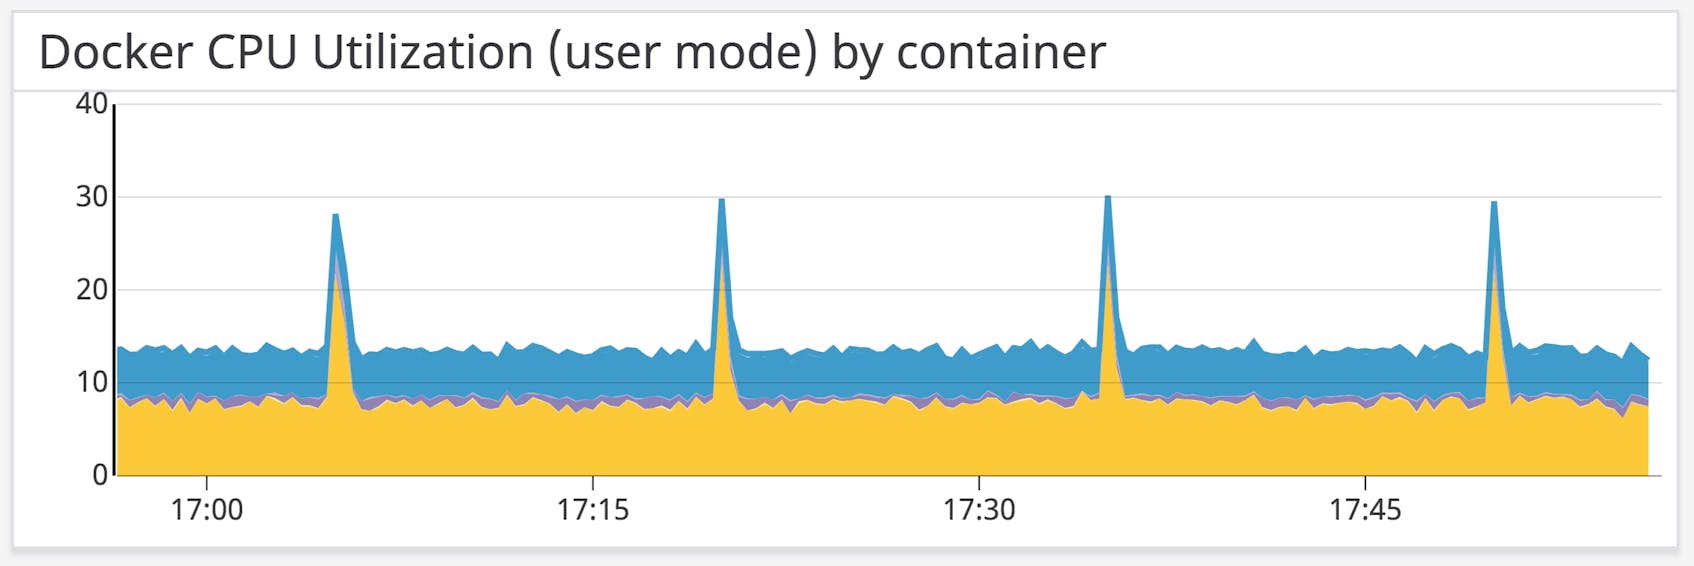
There are two reasons why you’d want to monitor the CPU utilization of individual containers within your ECS deployment. The first is to find the source of high ECS CPU utilization across a cluster or service. If you’ve updated a service to use a more recent version of a task definition, for example, your service might still run tasks with old versions of the definition, depending on how many tasks you’ve configured your service to keep running at once. If the newer tasks are more CPU-intensive than the old ones, container-level CPU metrics will indicate this (you may want to aggregate them by ECS task). Granular resource metrics can also provide visibility into task definitions that include multiple container images, any one of which might use an outsized proportion of CPU time. In cases like these, only monitoring CPU utilization per container can reveal the root of the issue.
A second, related reason to track container CPU usage is to help you throttle containers deployed within a single task. If occasional spikes in CPU utilization within one container stop other containers in the task from performing their required work, you’ll want to know which limits to set on the CPU-intensive container to keep the task running smoothly.
Memory metrics
| Name | Description | Metric Type | Availability |
|---|---|---|---|
| MemoryUtilization | The percentage of reserved memory being used by running tasks (per ECS cluster* or service) | Resource: Utilization | CloudWatch |
| Container memory usage | Current memory usage (per Docker container) | Resource: Utilization | Docker-specific methods (pseudo-files, stats command, and local API) |
| MemoryReservation | The percentage of memory reserved for all container instances in an ECS cluster that is reserved for running tasks (per ECS cluster*) | Resource: Other | CloudWatch |
| * only for the EC2 launch type |
Metrics to alert on
MemoryUtilization (ECS)
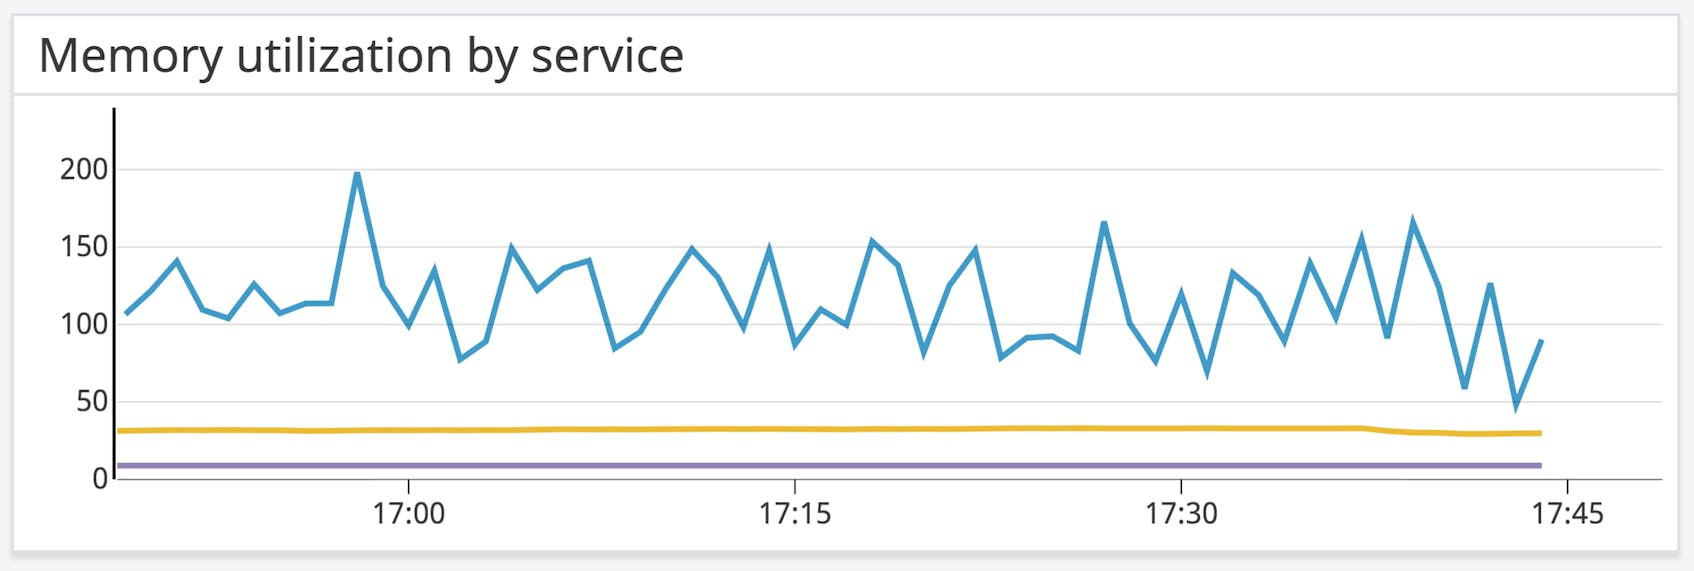
ECS will terminate any containers that exceed the hard memory limit—if you’ve set one, you’ll want to alert your team when MemoryUtilization approaches 100 percent to ensure that your containerized application remains available. If you’ve set only a soft limit, MemoryUtilization can exceed 100 percent without ECS killing containers, and knowing how often your application approaches or surpasses this threshold can help you avoid unexpected out-of-memory issues in an EC2 instance or unexpectedly high Fargate bills. As with CPUUtilization, this metric is a good way to tell how adequately you’ve scaled your ECS services and, in the EC2 launch type, your clusters.
Container memory usage
If you’ve reserved memory at the container level, you may want to monitor the memory usage of individual containers, rather than the task as a whole, to see if you have set appropriate limits. If you’ve set a hard limit on container-level memory usage, and containers from a single image or within a certain task routinely reach that limit, you may want to consider updating your task definitions to either increase the limit for the relevant container definitions or change them to a soft limit (MemoryReservation) instead.
Metrics to watch
MemoryReservation (ECS)
If your ECS deployment uses the EC2 launch type, you’ll want to monitor MemoryReservation for the same reasons you would CPUReservation, to make sure that your EC2 instances maintain enough resources to support your task placement strategy. If you’re using Service Auto Scaling, where ECS changes the number of tasks in a service dynamically, you’ll want to understand how your ECS cluster reserves memory over time, the most memory your cluster will reserve for running tasks, and how often your cluster reaches this peak. If your services are scaling up their number of running tasks with, for example, increased numbers of requests to a load balancer, the value of MemoryReservation will also increase.
As we discussed earlier, you have more explicit control over configuring soft and hard limits for memory in your container definitions than you have for CPU. If you’ve set soft limits for memory within your containers, determine whether exceeding those limits would cause memory contention and impact performance in your deployment. If so, consider setting hard limits instead to let ECS terminate the memory-intensive containers and restart them (and make sure you’ve scaled your tasks appropriately to ensure availability).
I/O metrics
Containerized environments are ephemeral, and you’ll want to be careful about how you approach storage. You can add an ECS storage configuration to a task definition by using the following options, based on the storage options within Docker:
- Volumes are managed by the Docker daemon and stored independently of the host’s filesystem. These are only available for the EC2 launch type.
- Bind mounts give a container access to a specific file path on the host. These are available for both the EC2 and Fargate launch types.
ECS adds new considerations to the mix, as you’ll need to decide whether storage should be persistent or follow the lifecycle of a single container. You’ll also need to choose what sort of infrastructure your storage will use (e.g., EBS or Amazon Elastic File System). You can configure these options with the volumes key of a task definition, which names an array of storage locations (including both Docker volumes and bind mounts) that the task’s containers can access.
Monitoring your ECS I/O can help you watch for misconfigurations and guide you toward an optimal solution.
| Name | Description | Metric Type | Availability |
|---|---|---|---|
| VolumeReadBytes, VolumeWriteBytes | Bytes transferred during read or write operations over a given period of time (per EBS volume) | Resource: Utilization | CloudWatch |
| I/O bytes | Number of bytes read and written (per Docker container) | Resource: Utilization | Docker-specific methods (pseudo-files, stats command, and local API) |
Metrics to watch: VolumeReadBytes, VolumeWriteBytes, I/O bytes
When using persistent storage with your ECS cluster, you can monitor the volume of bytes written to or read from each EC2 container instance, Docker container, or storage device, to ensure that your chosen configuration can accommodate demand. When setting up a bind mount with an EC2-based deployment, for example, you might configure one or more containers to mount an EBS volume that is already attached to your instances. Configuring your AMI to mount an Amazon Elastic File System (EFS) might be a better option if you expect high-throughput I/O workloads. CloudWatch gives you a variety of metrics for monitoring disk throughput.
Your containers might be able to boost performance by using Docker tmpfs mounts to store nonpersistent data in memory rather than on disk. In ECS, this is only possible for Linux container instances in the EC2 launch type. In your task definitions, this option is available within a container’s linuxParameters object. Unlike volumes and bind mounts, which you can configure to share between containers, a container’s tmpfs storage is limited to that container alone.
Network metrics
| Name | Description | Metric Type | Availability |
|---|---|---|---|
| NetworkOut, NetworkIn | Number of bytes sent or received (per EC2 instance)* | Resource: Utilization | CloudWatch |
| Bytes | Bytes sent and received (per Docker container) | Resource: Utilization | Docker-specific methods (pseudo-files, stats command, and local API) |
| NetworkPacketsOut, NetworkPacketsIn | Number of packets sent or received (per EC2 instance)* | Resource: Utilization | CloudWatch |
| Packets | Packets sent and received (per Docker container) | Resource: Utilization | Docker-specific methods (pseudo-files, stats command, and local API) |
| * only for the EC2 launch type |
Metrics to alert on: NetworkOut, NetworkIn, Bytes, NetworkPacketsOut, NetworkPacketsIn, Packets
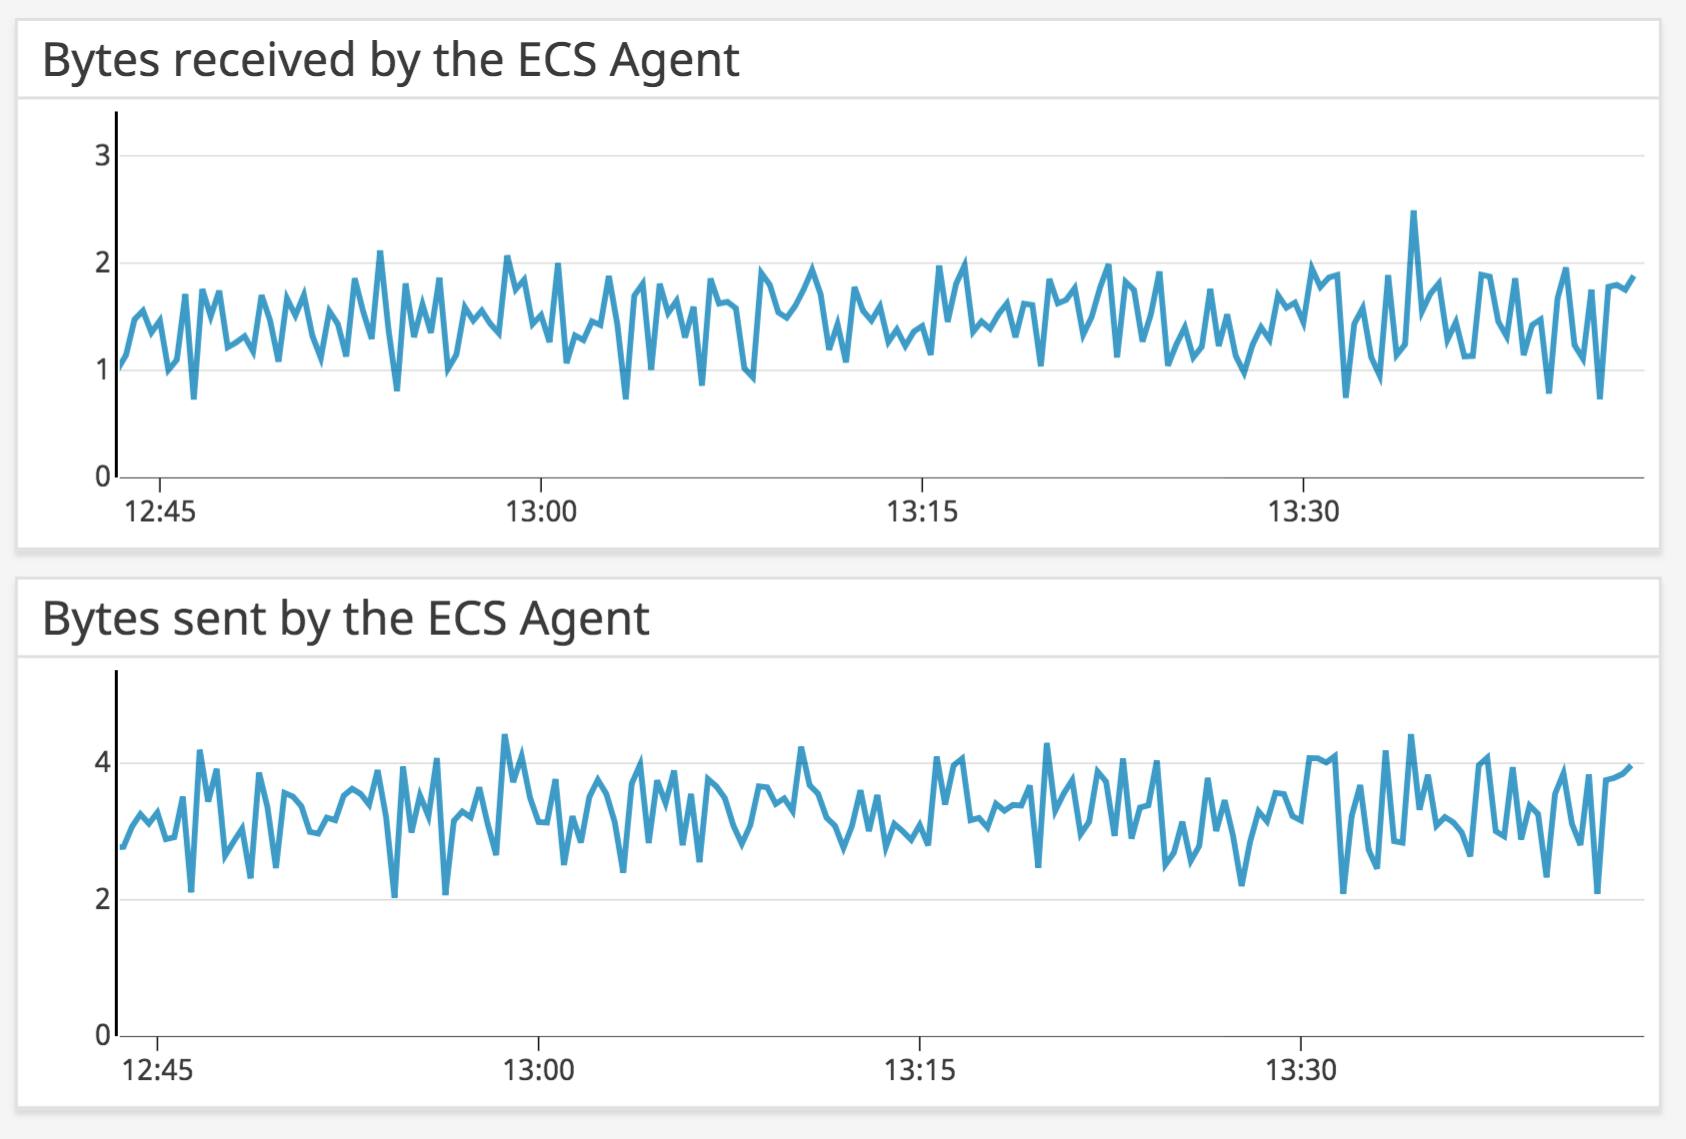
In ECS, tasks, containers, and hosts are networked, and it’s critical that you monitor the status of network connections within your cluster, whether they’re between the ECS Container Agent and the ECS API or between your own containerized microservices. Alert on sustained losses of network traffic in and out of your EC2 instances (as the case may be) and Docker containers, as that might be a sign of a misconfigured network.
Within a task definition, the networkMode key indicates how a task and its containers will connect to a network:
The
hostmode maps the container’s network ports onto that of the host.The
awsvpcmode (the required mode for Fargate) gives your task an elastic network interface, a primary private IP address, and internal DNS host name.The
bridgemode connects your containers to a Docker bridge network within the host.It’s also possible to disable port mapping and external connectivity within your containers by setting a task’s
networkModetonone.
The host and awsvpc network modes use the EC2 network stack and promise higher performance than bridge, but the bridge network mode lets you configure dynamic port mapping, which maps a container port to a host port within the ephemeral port range. Monitoring network throughput can help you determine the most performant configuration and watch for misconfigured networks (by, for instance, alerting on a sudden drop in bytes transmitted).
Tracking ECS status
ECS manages the state of your clusters through a backend key-value store that you can access through the ECS API. And when monitoring ECS, you can use the API to obtain information about the status of tasks and services within the cluster. In Part 2 of this series, we’ll explain these commands in further detail.
| Name | Description | Metric Type | Availability |
|---|---|---|---|
runningCount | Number of tasks currently running (per ECS service) | Other | ECS API |
runningTasksCount | Number of tasks currently running (per ECS container instance* or cluster) | Other | ECS API |
pendingCount | Number of tasks that are pending (per ECS service) | Other | ECS API |
pendingTasksCount | Number of tasks pending (per ECS container instance* or cluster) | Other | ECS API |
desiredCount | Number of times a task has been slated to run, as indicated in its task definition (per ECS service) | Other | ECS API |
| * only for the EC2 launch type |
Metrics to watch
runningCount, runningTasksCount
For a basic indicator of how busy your ECS infrastructure is, you can track the number of tasks running within a container instance, service, and cluster.
The metric runningCount can also show whether your services are running tasks as expected. When creating or updating a service, you can specify not only the number of “desired” tasks (how many tasks the service will attempt to keep running), but also how many tasks from a previous deployment to keep running while new ones are launched:
maximumPercent: the highest percentage of desired tasks in a service ECS can keepRUNNINGorPENDING. Defaults to 200 percent.minimumHealthyPercent: the percentage of desired tasks in a service ECS will always try to keepRUNNING. Must be less than or equal to 100 percent.
Each of these parameters is expressed as a percentage of the desired tasks in a service. Counting a service’s running tasks can show how these parameters affect your system. If you’ve left maximumPercent at the default value (200 percent), and the next deployment of your service has the same number of desired tasks as the previous one, the new deployment will simply double the number of RUNNING tasks—that number will only decrease if you stop tasks within the service manually or they stop on their own. If minimumHealthyPercent is 50 percent, ECS can only stop up to half of the tasks in your service at any one time.
You’ll want to understand how often your services reach their maximum and minimum capacities, and whether these extremes correspond with any performance issues or losses in availability.
pendingCount, pendingTasksCount
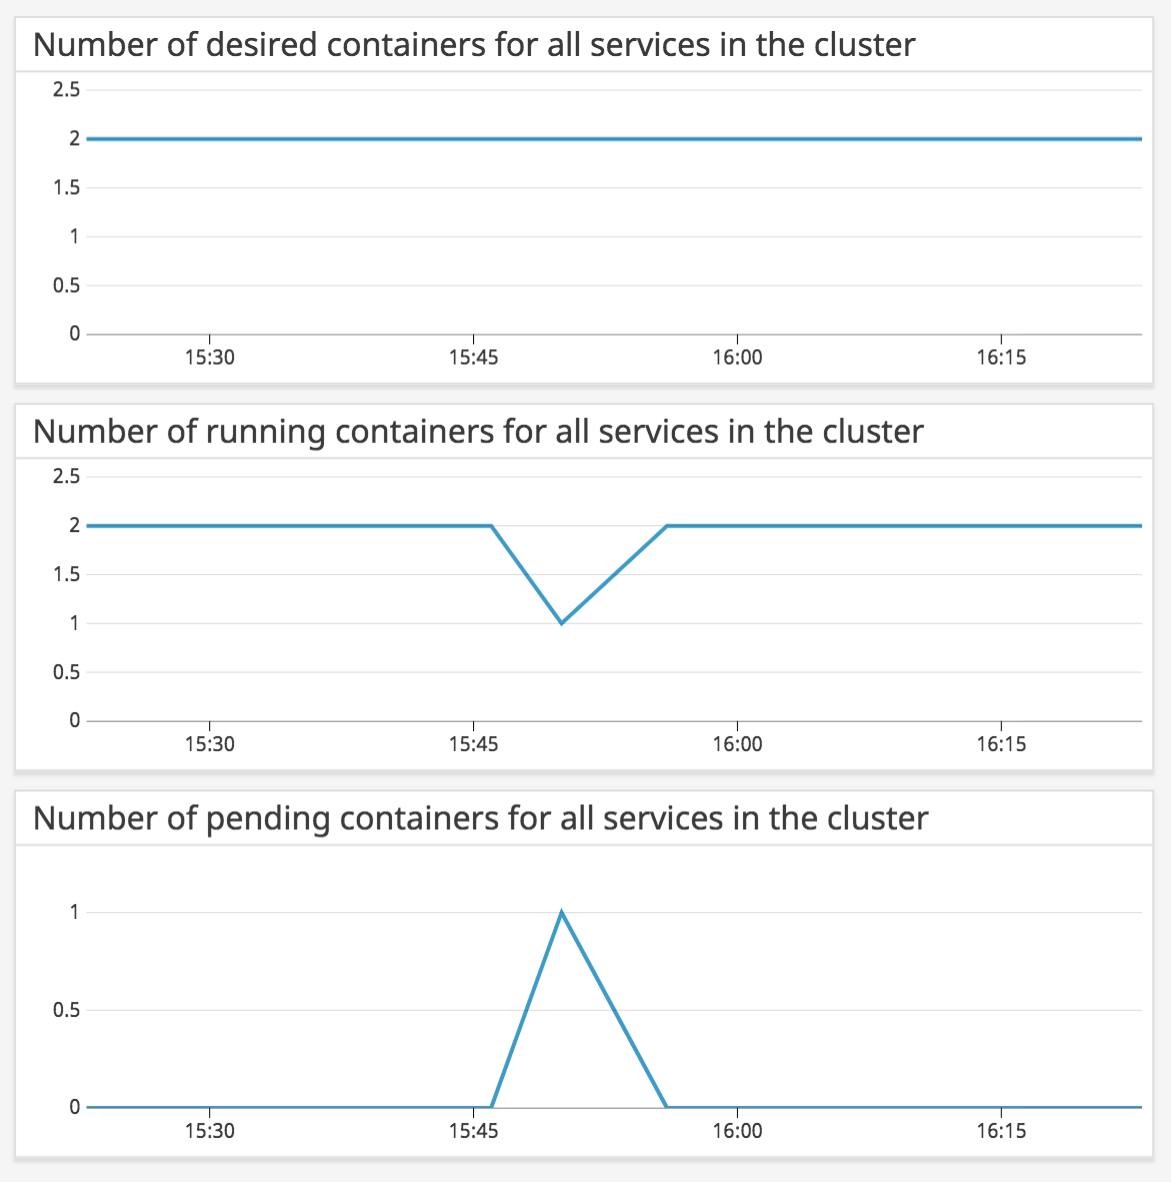
If the count of pending tasks has dropped, and no running tasks have taken their place, it could be the case that some of your tasks have stopped unexpectedly. When a task is PENDING but moves to STOPPED or disappears, Amazon recommends inspecting the ECS console to find out the reason. You might see, for instance, that a task has failed an Elastic Load Balancing health check, or the EC2 instance running the task has been stopped or terminated.
desiredCount
Comparing desiredCount with runningCount is one way to determine whether a service has run as expected. For instance, if you see a drop in the ratio of runningCount to desiredCount, this could indicate that ECS has run into resource constraints or other issues placing tasks (and you can look for ECS service events around the same time to see why this is the case).
Get visibility into your ECS cluster
In this post, we’ve shown you the metrics to follow to determine whether your ECS infrastructure is facing issues, and which ones can lead you toward a more optimal configuration. When monitoring ECS, you’ll need to collect metrics from the ECS and CloudWatch APIs while also tracking resource use among EC2 instances and Docker containers. In the next part of this series, we’ll show you how to collect all the ECS metrics we introduced in this post.
_We wish to thank our friends at AWS for their technical review of this series._


