John Matson
In our Monitoring 101 series, we introduced a high-level framework for monitoring and alerting on metrics and events from your applications and infrastructure. In this series we’ll go a bit deeper on alerting specifics, breaking down several different alert types. In this post we cover four types of status checks that poll or ping a particular component to verify if it is up or down:
In a companion post, we’ll explore more open-ended alerts that evaluate timeseries metrics—not only instantaneous values, but also their evolution over time.
What’s an “alert” anyway?
All alerts are not created equal. To recap our Monitoring 101 article on alerting: An alert can take one of three forms, depending on the urgency. A record does not notify anyone directly but creates a durable, visible record of unexpected or notable activity; a notification calls attention to a potential problem in a noninterrupting way (often via email or chat); and a page urgently calls attention to a serious issue by interrupting a responder, whatever the hour.
Individual checks vs cluster checks
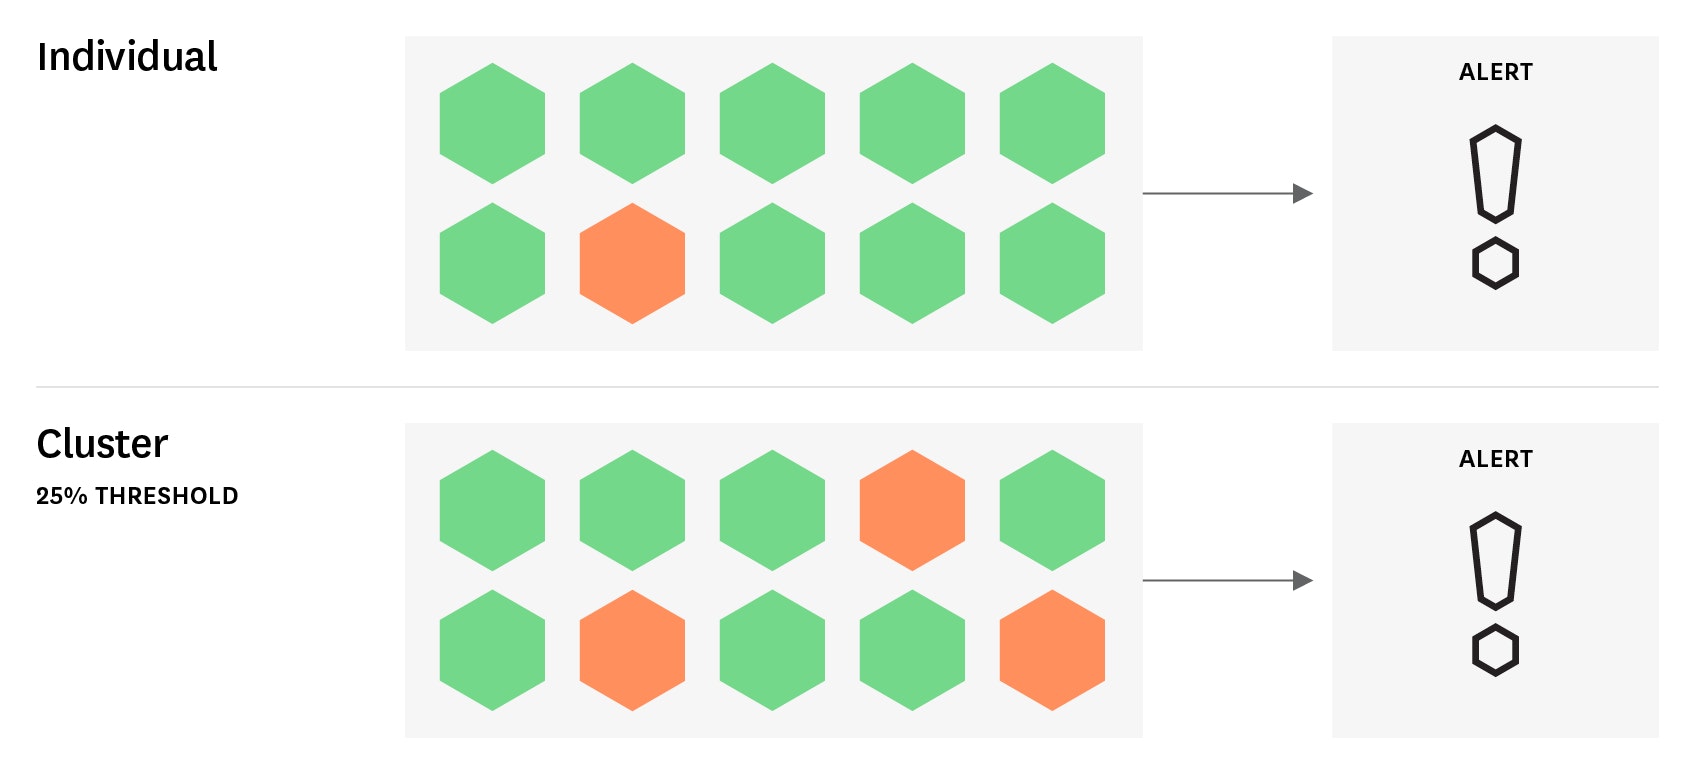
Before we get into the specifics of different status checks, let’s pause to explain an extra wrinkle in the fabric of these checks. Although status checks are binary at their core (is component X up or down?), you will rarely want to fire off an alert for a single failed check in a modern system that is designed to weather some degree of failure. So you will often want to roll multiple status checks into a single cluster check to more effectively monitor your systems and reduce alert fatigue. A cluster check triggers on a widespread failure (e.g., more than 25 percent of the monitored population is returning a CRITICAL status) rather than on an isolated failure (one monitored host dropped out of the pool).

Host checks

In their simplest form, host checks hark back to the days of pets, not cattle. Servers were long-lived, often affectionately tagged with memorable names. If one of those pet servers fell ill for any reason, sysadmins would want to know right away. A host check is designed to do just that—to fire off an alert if the monitoring agent on that host stops sending a heartbeat signal to the monitoring system.
Host checks are still used in this way, but they have also evolved with the adoption of tags and labels for dynamic infrastructure. You can build alerts around tags that describe key properties of hosts (location, role, instance type, auto-scaling group) rather than around specific host names, so your alerts on key hosts will be robust to changing infrastructure. For instance, you might monitor the status of all the instances of a mission-critical data store, but only page someone when the check fails for a host tagged with role:backend-primary.
Cluster host checks are useful for monitoring distributed systems such as Cassandra, where you can often withstand some node loss but may need a quorum of healthy nodes to continue to serve requests.
Service checks

As the name implies, service checks monitor the up/down status of a given service. A service alert will fire whenever the monitoring agent fails to connect to that service in a specified number of consecutive checks. For instance, you can fire an alert any time the monitoring agent on a Redis host reports three consecutive failed attempts to connect to Redis and collect metrics.
Service checks at the cluster level offer another effective way to monitor distributed or redundant systems that can withstand some failures. These alerts are valuable for architectures in which individual hosts run multiple services, as they can surface the degradation of a given service even if the hosts running that service remain available (and would therefore pass a host-level health check).
Service checks warrant a page in some circumstances: if a critical, non-redundant service is lost, or if a cluster is on the verge of failure due to widespread node loss. For many services such as HTTP servers, however, a failed service check is usually just a potential cause of problems (and hence not worthy of a page), whereas a drop in request throughput or an increase in request latency would be a symptom worthy of paging.
Process checks

Process checks can be used interchangeably with service checks, but they monitor services at a lower level and are a bit more customizable. Instead of alerting on the monitoring agent’s failure to connect to a given service, they alert on the status of a specified process (e.g. sshd).
Process checks are especially useful for monitoring custom services. In lieu of using your monitoring agent’s built-in service health checks, as you might do for an off-the-shelf technology, you can use a process check to ensure that your custom-built service is running on a given set of hosts. At the individual or cluster level, you can use process checks to ensure that your service is not failing silently on otherwise healthy instances.
Network checks

Network checks are extremely versatile. They monitor the network connectivity between a given location or host and an HTTP or TCP endpoint. You can use network checks to verify the availability or responsiveness of public or private endpoints, from APIs to web pages. By running network checks from locations around the globe, you can quickly identify regional network issues that may be affecting your services or users. Notifications or records from network checks can also provide valuable context when timeouts pile up or latency spikes.
Given how important connectivity is to modern infrastructure, it can be tempting to page someone anytime a key endpoint becomes unavailable. But transient network issues are common, so cluster-level network alerts are often more appropriate than potentially flappy alerts based on the connectivity of one host or location. And any alert that wakes someone in the night needs to be actionable, so only page on the availability of an external endpoint if the responder has an available remediation (such as failing over to a secondary service) or an action to take (such as updating a status page).
Beyond the here and now
As we’ve shown here, all four alert types covered in this post share a few common properties: They can often be applied at the individual level or the cluster level, and they all take an up-or-down status check as their core measure of system health. In the next installment in this series, we look at checks that evaluate a more continuous domain—timeseries metric values.


