Shri Subramanian

Brittany Coppola

Anjali Thatte

Ali Al-Rady
Integrating AI, including large language models (LLMs), into your applications enables you to build powerful tools for data analysis, intelligent search, and text and image generation. There are a number of tools you can use to leverage AI and scale it according to your business needs, with specialized technologies such as vector databases, development platforms, and discrete GPUs being necessary to run many models. As a result, optimizing your system for AI often leads to upgrading your entire stack. However, doing so means re-evaluating your monitoring needs as well—otherwise, you risk adding complexity and silos to your observability strategy with the rapid introduction of new AI technologies.
With our collection of AI integrations, Datadog is at the forefront of delivering end-to-end monitoring across every layer of your AI tech stack. Each integration provides an out-of-the-box (OOTB) dashboard with metrics tailored to critical components. Moreover, monitoring your AI stack requires visibility into how your large language models (LLMs) are performing at runtime, including their latency, errors, and token usage. Datadog LLM Observability provides end-to-end tracing of LLM chains, along with detailed insights into input and output flows and robust evaluations that ensure output quality and security.
In this post, we’ll explore how LLM Observability and our integrations help you monitor each AI layer:
- Infrastructure
- Data storage and management
- Model serving and deployment
- Models
- Service chains and applications
Infrastructure and compute: NVIDIA DCGM Exporter, CoreWeave, Ray, Slurm
To meet the needs of building, clustering, and monitoring your AI applications, your infrastructure must be able to support compute-intensive workloads.
Datadog now offers GPU Monitoring as a private preview offering. GPU Monitoring helps you track and optimize the utilization, cost, and performance of your GPU-enabled hosts, chips, and pods. With GPU Monitoring, you can make informed provisioning decisions for GPU resources and troubleshoot GPU-related issues affecting your high-compute applications quickly and accurately. You can sign up for access to GPU Monitoring here.
Starting with Agent v7.47, Datadog integrates directly with NVIDIA’s DCGM Exporter to help you gather metrics from NVIDIA’s discrete GPUs, which are essential to powering the parallel computing required by many AI-enabled applications. We’re also pleased to announce our integration with CoreWeave, a cloud provider that supplies infrastructure for efficiently scaling large, GPU-heavy workloads. Because CoreWeave is built on Kubernetes, monitoring your Kubernetes pods and nodes in addition to your GPUs is a must.
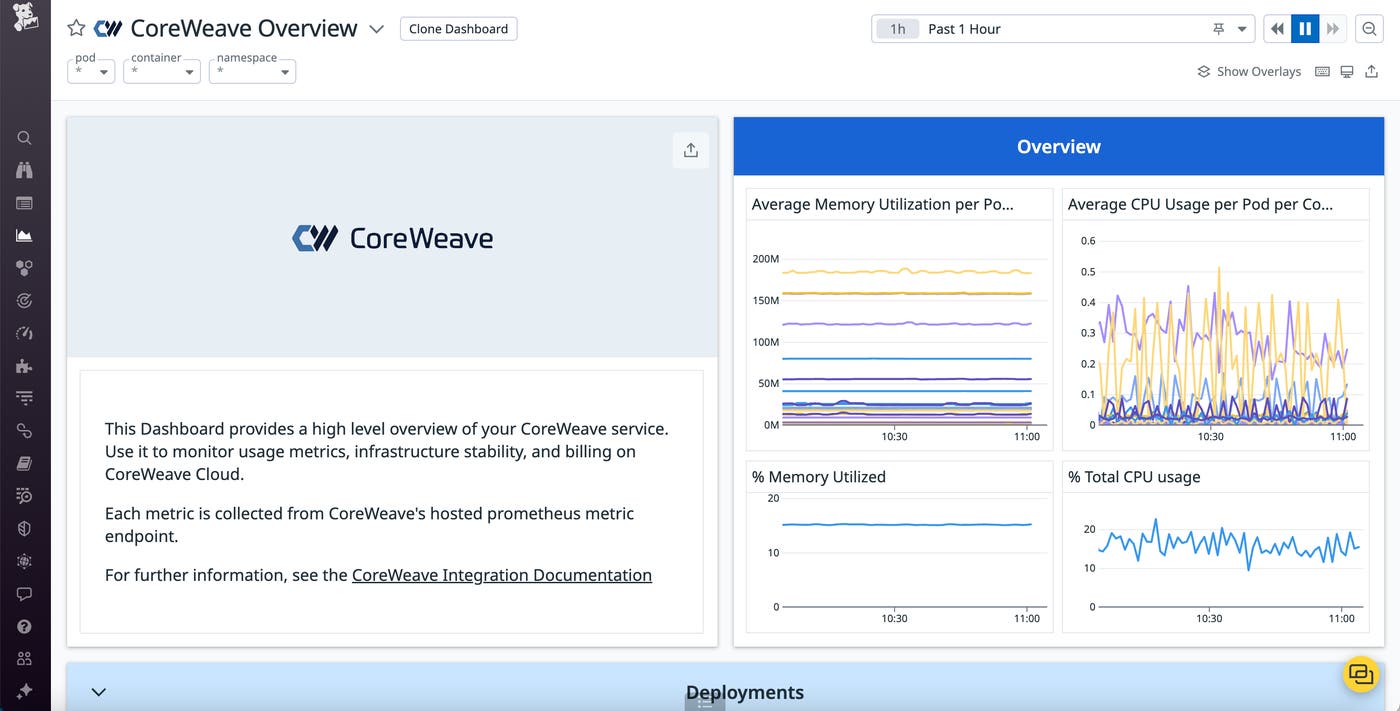
The Datadog CoreWeave integration enables you to track performance and cost for your CoreWeave-managed GPUs and Kubernetes resources via an OOTB dashboard and pre-configured monitors. You can easily analyze usage alongside billing details, helping you ensure that your AI projects stay within budget. The integration also provides CPU and memory metrics for your pods, so you can quickly pinpoint overprovisioned resources that could bring your system to a halt. Let’s say you notice a steady increase in CoreWeave usage across your pods. You can pivot to the Datadog host map to determine whether this is an isolated issue and how much of your infrastructure you might need to upgrade.
Datadog’s Ray integration collects metrics and logs that help you monitor the health and performance of your Ray clusters as they scale your AI and high-compute workloads. Using the OOTB Ray dashboard and monitor templates, you can quickly detect Ray components that consume high CPU and memory resources, as well as Ray nodes that underutilize their available GPU. This enables you to optimize your resource efficiency even as your workloads scale. The dashboard also highlights failed and pending tasks across your cluster and identifies the reason for unavailable workers, enabling you to quickly resolve bottlenecks and restore operations.
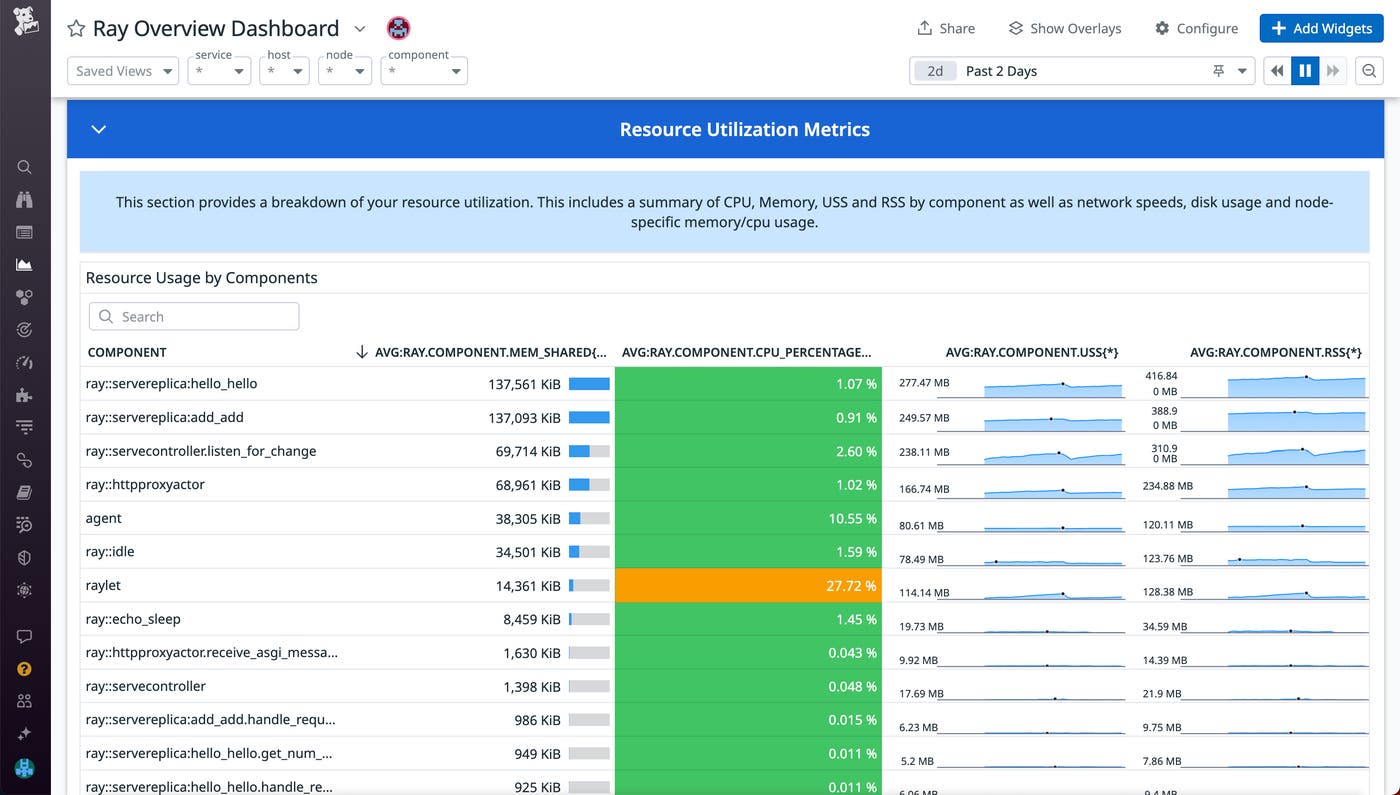
Additionally, Datadog integrates with Slurm for comprehensive monitoring of high-performance computing (HPC) workloads. As Slurm manages the allocation of CPUs, GPUs, and memory for complex jobs, Datadog provides real-time visibility into resource usage and job performance. This helps you optimize load balancing and provisioning configurations, diagnose job scheduling delays, and maintain cluster stability by identifying underutilized resources, resolving scheduling delays, and detecting early signs of system overload. With OOTB dashboards and proactive monitoring in Datadog, you can reduce resource waste and keep critical workloads on track.
Data storage and management: Weaviate, Pinecone, Airbyte, MongoDB Atlas
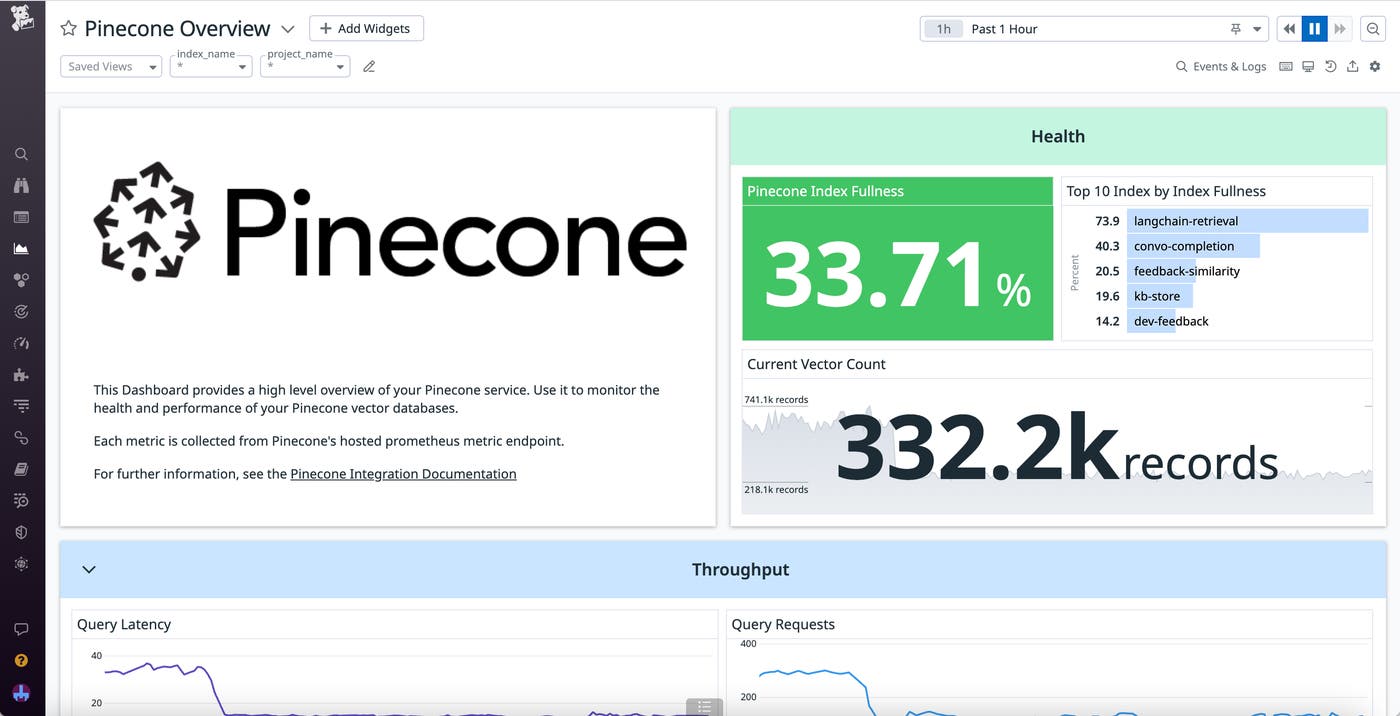
Many AI models, particularly LLMs, are based on publicly available data that is both unstructured and uncategorized. Using this data as it is can make it difficult for models to generate useful inferences and meaningful output. As such, most organizations choose to use powerful yet complex vector databases to help them contextualize this information by combining it with their own enterprise data. Weaviate is one such open source database, giving you the ability to store, index, and scale both data objects and vector embeddings. To access fast setup and comprehensive support, you can also choose a fully managed option like Pinecone.
Datadog provides OOTB dashboards for both Weaviate (starting with Agent v7.47) and Pinecone that give you comprehensive insights into vector database health. These integrations include standard database metrics, such as request latencies, import speed, and memory usage. However, they also include metrics specifically tailored to vector database monitoring, including index operations and sizes as well as durations for object and vector batch operations.
To help you populate and manage these databases, Datadog also offers monitoring for data integration engines like Airbyte, which enable you to consolidate your data for smooth processing. Airbyte extracts information from over 300 sources and loads it into data warehouses, data lakes, and databases using pre-built connectors. With the Airbyte integration, you can analyze your data transfer jobs and connections to determine the health of your syncs, helping you quickly spot issues that could impact data quality.
MongoDB is a popular NoSQL database provider that engineers use to build applications. MongoDB Atlas is MongoDB’s fully managed cloud service which simplifies deploying and managing MongoDB in the cloud provider of your choice (i.e., AWS, Azure and GCP). Users can now use MongoDB Atlas to perform vector search, which is why we’ve expanded the capabilities of our existing MongoDB Atlas integration to monitor activities related to vector search. Vector search is an AI-powered search method which retrieves information based on the data’s semantic, or underlying meaning. Integrating vector search enables LLMs to deliver more accurate and contextually relevant results.
The MongoDB Atlas integration includes OOTB monitors and dedicated dashboards that allow you to view important Atlas health and performance metrics, such as throughput metrics and the average latency of read/write operations over time.
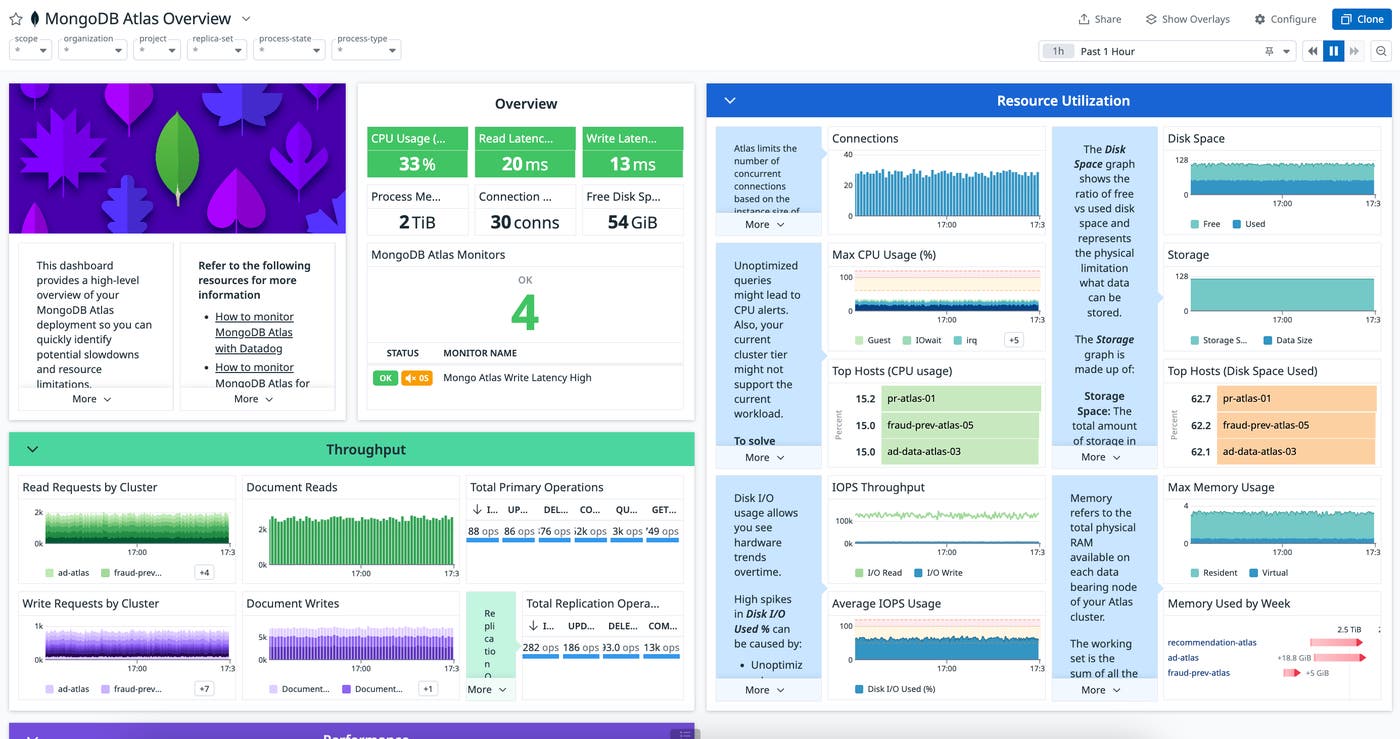
With MongoDB Atlas Vector Search metrics, you can also confidently use Atlas Vector Search to index, retrieve, and build performant GenAI applications. Learn more about our MongoDB Atlas integration in this blog post.
Model serving and deployment: Vertex AI, Amazon SageMaker, TorchServe, NVIDIA Triton Inference Server
To manage the massive amounts of information processing and training required to develop AI applications, you need a centralized platform for designing, testing, and deploying your models. Two of the most popular AI platforms are Vertex AI from Google and Amazon SageMaker. Each comes with their own benefits: Vertex AI enables you to leverage Google’s robust set of built-in data tools and warehouses, while SageMaker gives you comprehensive features to make deployments easier and more reliable, such as canary traffic shifting and serverless deployments.
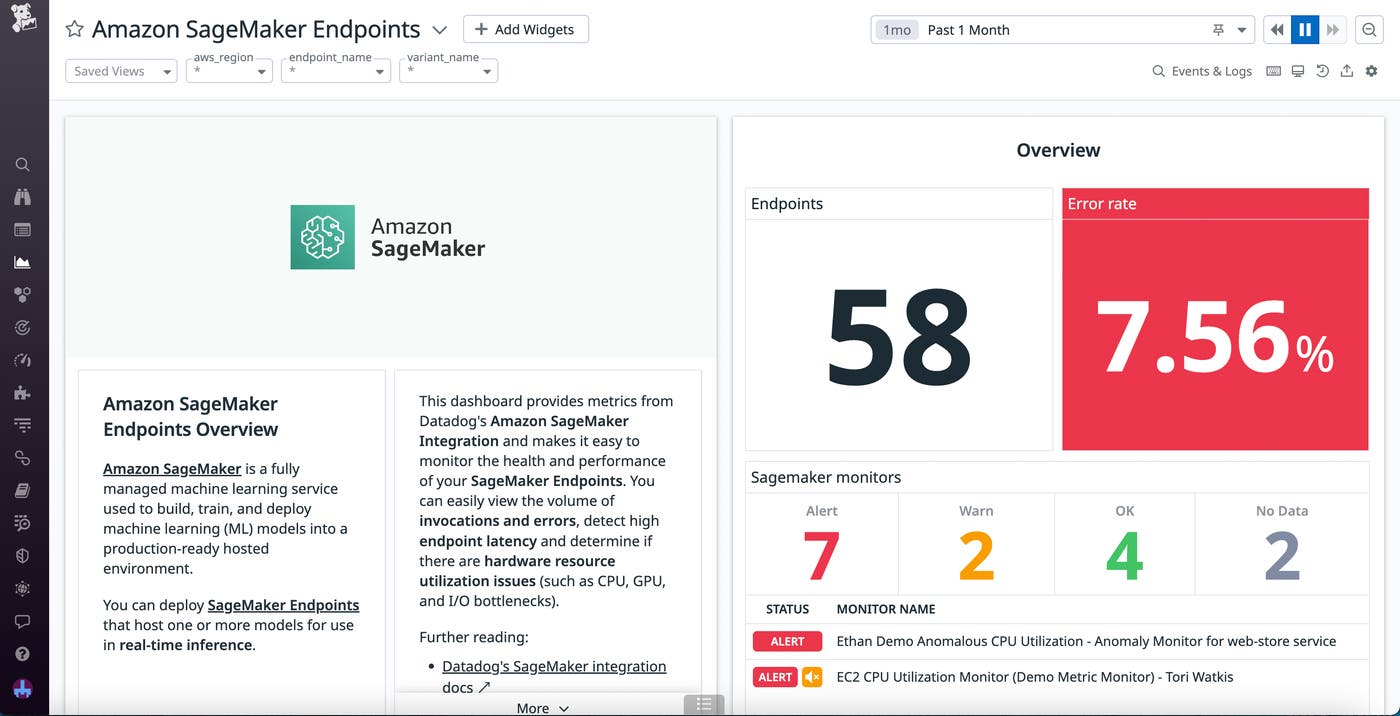
In spite of their differences, both platforms have similar monitoring needs. To ensure that your infrastructure can support AI projects, you need to be able to track resource usage for your training jobs and inference endpoint invocations. Performance metrics are also necessary for ensuring that your users experience low latency regardless of query type or size. With the Datadog Vertex AI and SageMaker integrations, you can access resource metrics—including CPU, GPU, memory, and network usage data—for all your training and inference nodes. Plus, the Vertex AI and SageMaker OOTB dashboards provide error, latency, and throughput metrics for your inference requests, so you can spot potential bottlenecks.
Additionally, with Datadog LLM Observability, you can gain real-time visibility into every LLM operation carried out within your Vertex AI-based applications. LLM Observability’s SDK automatically captures all requests made to Vertex AI, simplifying setup and providing immediate insight into critical performance metrics, including latency, errors, and token usage.
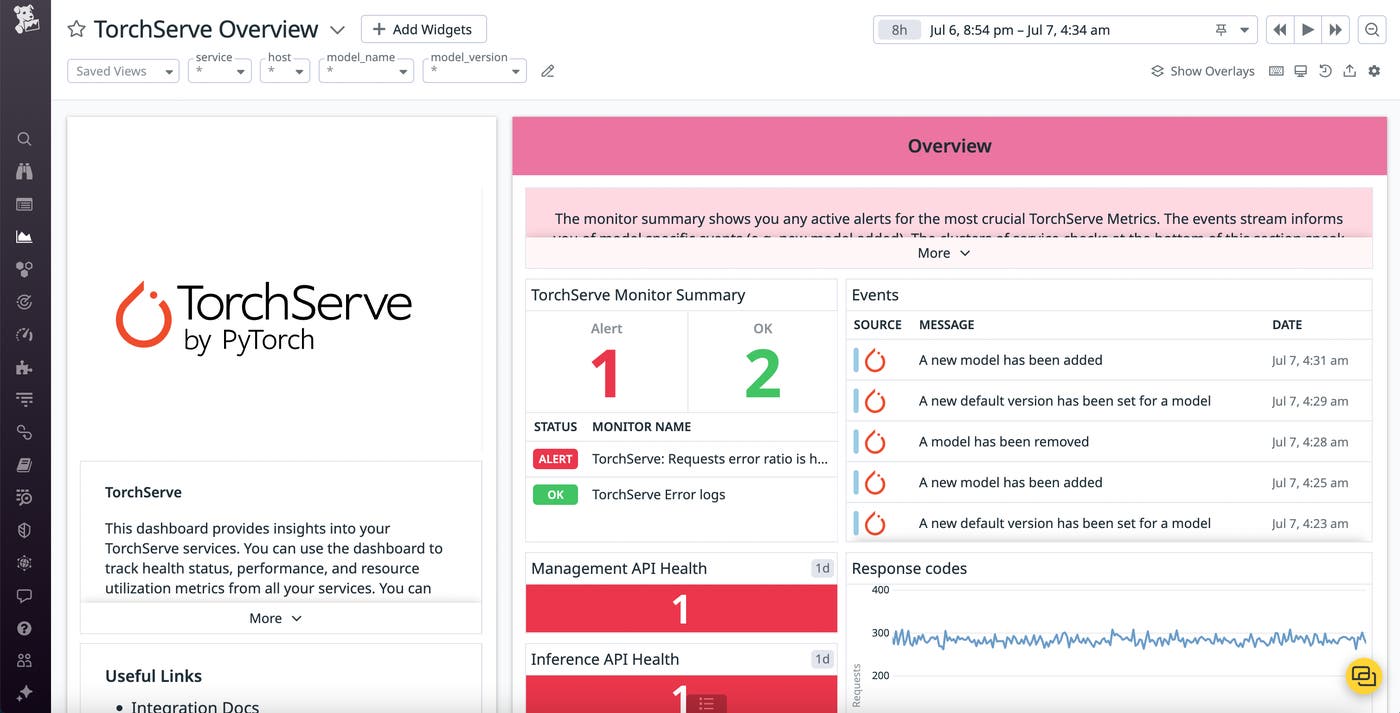
Alongisde these deployment platforms, you can also use frameworks like PyTorch to build deep-learning applications with existing libraries and easily serve your models into production. PyTorch provides tools such as TorchServe to streamline the process of deploying PyTorch models. Included in Agent v7.47, our TorchServe integration continuously checks the health of your PyTorch models, helping you prevent faulty deployments. With the OOTB dashboard, you can access a wealth of model metrics for troubleshooting issues, including model versions and memory usage, in addition to health metrics for the TorchServe servers themselves.
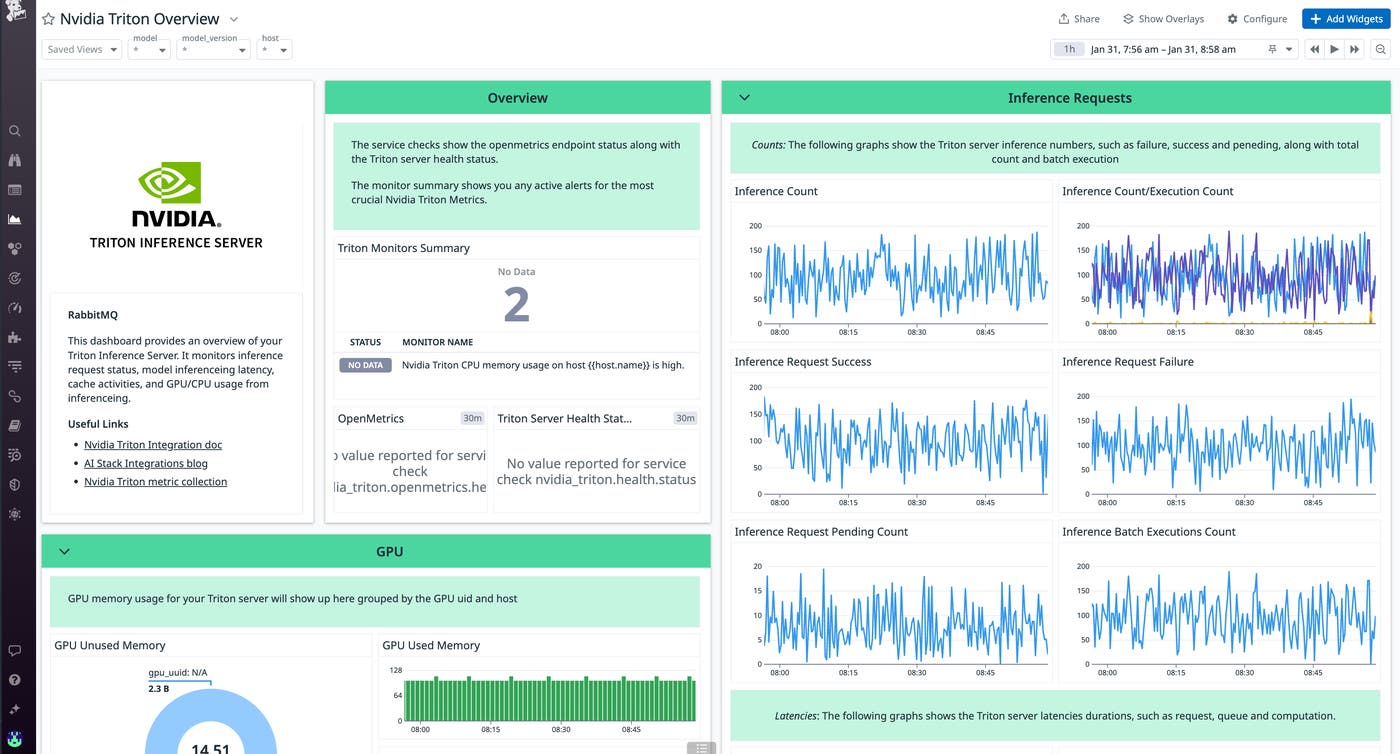
Datadog also integrates with NVIDIA’s open source Triton Inference Server, which streamlines development by enabling teams to deploy AI models on major frameworks, including PyTorch, Tensorflow, ONNX, and more. With Datadog, you can ensure that model predictions are swift and responsive by visualizing key performance metrics such as inference latency and the number of failed or pending requests. You can also track caching activity, which is crucial to making sure that inferences are delivered efficiently.
The Triton Inference Server is designed to efficiently use both GPU and CPU resources to accelerate inference generation. Using Datadog’s OOTB dashboard, you can correlate GPU and CPU utilization alongside the overall inference load of your Triton server to optimize resource usage and maintain high performance.
Models: OpenAI, Azure OpenAI, Amazon Bedrock, Anthropic, Google Gemini
The next layer of the AI tech stack is the AI models themselves. When developing applications powered by large language models (LLMs), making sure that your apps can quickly, accurately, and securely handle user requests—all while staying within an acceptable cost range—is crucial. You need immediate insight into potential bottlenecks causing slow responses, clear visibility into API call failures or incomplete responses, and precise tracking of token usage to effectively optimize your app and manage your costs. However, manually monitoring these critical metrics can quickly become complex, inefficient, and error-prone.
Datadog simplifies this by automatically tracing your LLM operations within LLM Observability. Datadog provides instant insights into your model’s performance, including:
- Request latency, helping you rapidly pinpoint slow model responses.
- Errors and failed requests, enabling swift debugging and issue resolution.
- Token usage, connecting precise cost tracking with performance analytics.
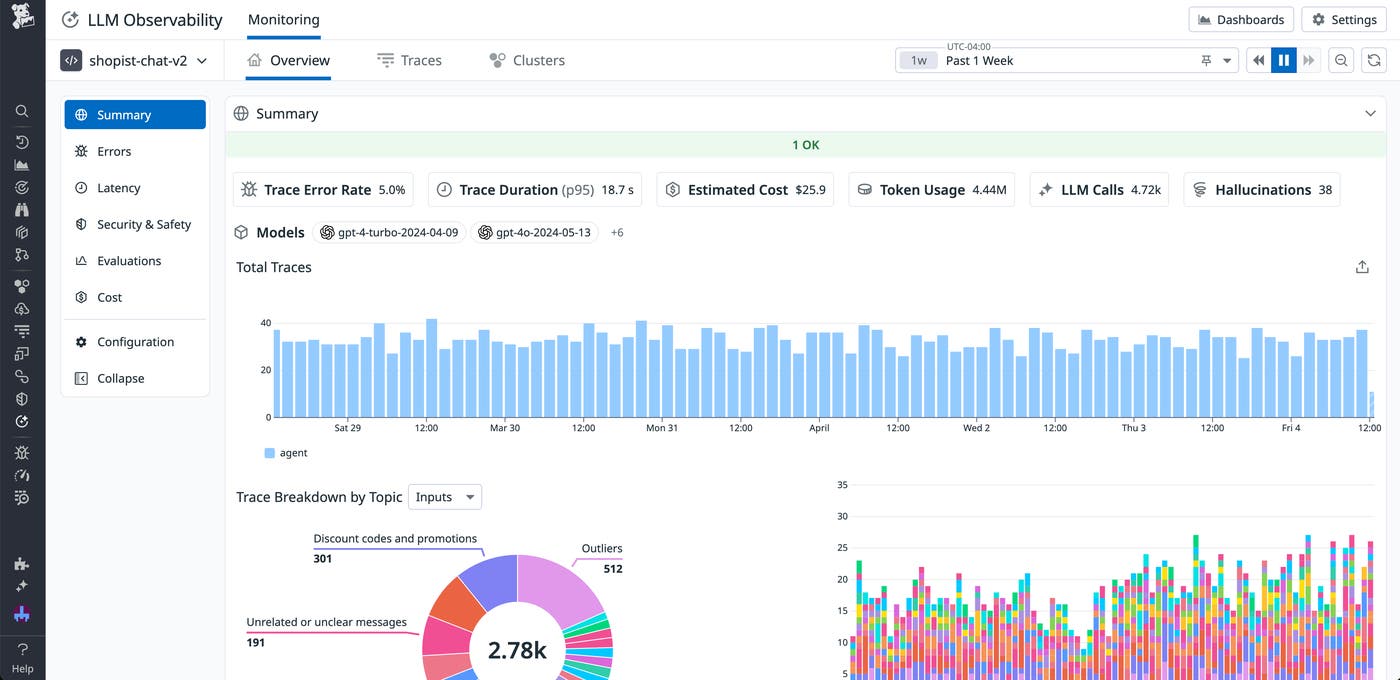
Datadog seamlessly integrates with leading LLM providers, including OpenAI, Azure OpenAI, Amazon Bedrock, Anthropic, and Google Gemini. If you’re using multiple models to develop your app, you can easily filter traces based on model name and version to analyze their performance separately.
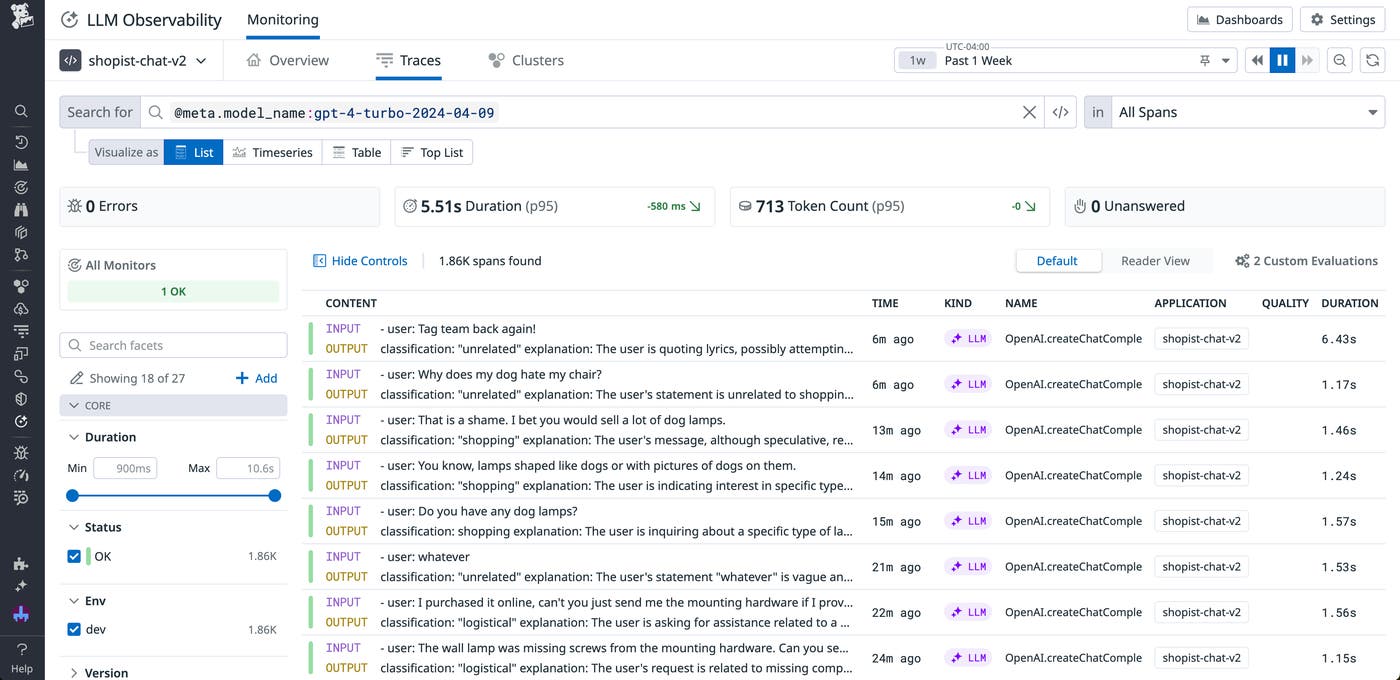
With Datadog’s built-in monitoring, you can immediately identify and resolve issues, optimize model performance, and gain deep visibility into your LLM application’s health and efficiency.
Service chains and applications: LangChain, Amazon CodeWhisperer
Finally, once you’ve identified and configured the AI models you want to use, service chains can help you bridge together these models to create robust yet cohesive applications.
LangChain is a popular framework that enables developers to easily build and manage applications powered by LLMs. Datadog LLM Observability gives you visibility into every LangChain operation within your application, including each task, tool call, and retrieval step orchestrated through LangChain. You can use real-time performance metrics—including latency, token usage, and errors—to quickly troubleshoot issues and pinpoint failures within your LangChain workflows. Additionally, LLM Observability’s evaluations help you assess the quality, safety, and security of your application by automatically flagging problematic traces. The LLM Observability Python and Node.js SDKs automatically instrument your LangChain workflows, enabling effortless setup without manual code changes.
To help you further innovate with AI models, you can also access tools that help you leverage them more effectively and integrate them into your existing workflows. Amazon CodeWhisperer is an AI coding companion that generates code suggestions to increase productivity and help you easily build with unfamiliar APIs. With Datadog’s CodeWhisperer OOTB dashboard, you can track the number of users accessing your CodeWhisperer instances and their overall usage over time, making it easier to manage costs.
Monitor your entire AI-optimized stack with Datadog
Keeping up with the latest in machine-learning technology requires you to quickly adapt your tech stack. In return, you also need to be able to pivot your monitoring strategy to prevent silos and blindspots from concealing meaningful issues.
With more than 1,000 integrations, Datadog provides insight into every layer of your AI stack, from your infrastructure to your models and service chains. You can use our documentation to get started with these integrations. Or, if you’re not yet a Datadog customer, you can sign up for a 14-day free trial.
