
David Lentz
ActiveMQ is a message broker that uses standard protocols to route messages between disparate services. ActiveMQ currently offers two versions—Classic and Artemis—that it plans to merge into a single version in the future. Both versions provide high throughput, support synchronous and asynchronous messaging, and allow you connect loosely coupled services written in different languages.
We've updated our integration so you can now monitor ActiveMQ Artemis as well as Classic—along with other technologies in your stack—to gain deep visibility into your messaging infrastructure.
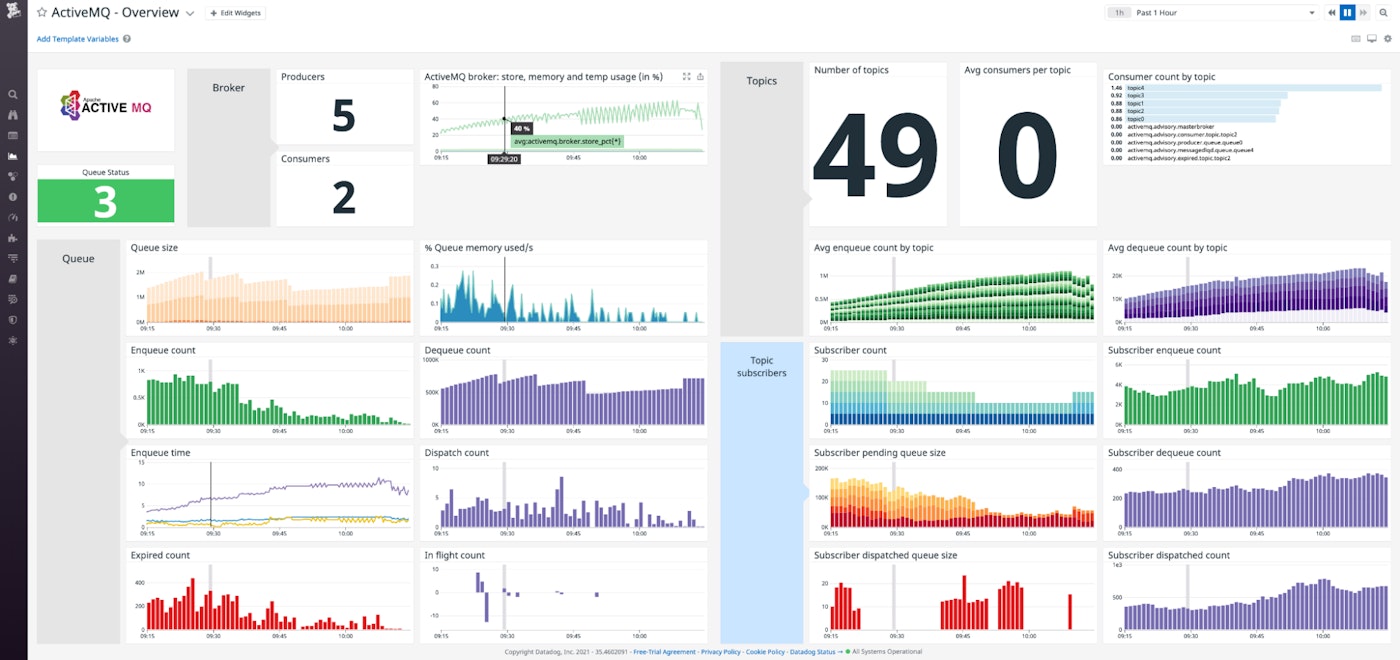
In this post, we'll show you how Datadog enables you to:
- Collect and analyze ActiveMQ metrics
- View logs to see details about ActiveMQ activity
- Use tags to correlate monitoring data from all of your ActiveMQ components
Gain insight through ActiveMQ metrics
Both versions of ActiveMQ support point-to-point messaging (which routes each message to a single consumer) and publish/subscribe (or pub/sub) messaging (which sends a copy of each message to multiple consumers). ActiveMQ Classic brokers send each message to one of two types of destinations that determine how the message is routed to consumers—either a queue for point-to-point messaging or a topic for pub/sub messaging. ActiveMQ Artemis brokers send messages to addresses, which organize messages in queues that can support both types of messaging.
In this section, we'll show you how you can use Datadog to collect and view key metrics from ActiveMQ Classic and Artemis.
Monitor all of ActiveMQ's components
The Datadog Agent automatically collects metrics from ActiveMQ brokers, destinations, and addresses. In Datadog, your ActiveMQ Artemis metric names are in the format activemq.artemis.*, whereas Classic metrics are named with simply activemq.*, as shown in the documentation. You can explore these metrics on dashboards and create alerts to notify your team about potential ActiveMQ issues.
Each broker emits metrics that show you resource usage across all of its destinations or addresses. For example, ActiveMQ Classic's activemq.broker.memory_pct metric shows the percentage of the broker's available memory in use across all of its destinations. While this metric alone can't tell you how that space is being used—for example, which queue is responsible for high memory usage—it can help you spot broker-level resource constraints that could affect all queues, topics, or addresses associated with that broker.
Whereas broker metrics show you aggregated resource usage, you can also see metrics that show you how each destination (in ActiveMQ Classic) and address (in ActiveMQ Artemis) is using resources and how much work it is doing. For example, to see an overview of a queue's activity, you can track its consumer count (shown in the activemq.queue.consumer_count metric in ActiveMQ Classic and activemq.artemis.queue.consumer_count in Artemis) and the rate at which messages are enqueued (in activemq.queue.enqueue_count and activemq.artemis.queue.messages_added). Monitoring metrics like these can help you troubleshoot ActiveMQ's performance, for example by correlating a queue's high memory utilization with a drop in the rate of messages added to that queue.
The screenshot below shows the built-in dashboard for ActiveMQ Artemis. This collection of graphs makes it easy to correlate the resource usage of the broker with various key metrics, including the volume of consumers, connections, and messages in your queues.
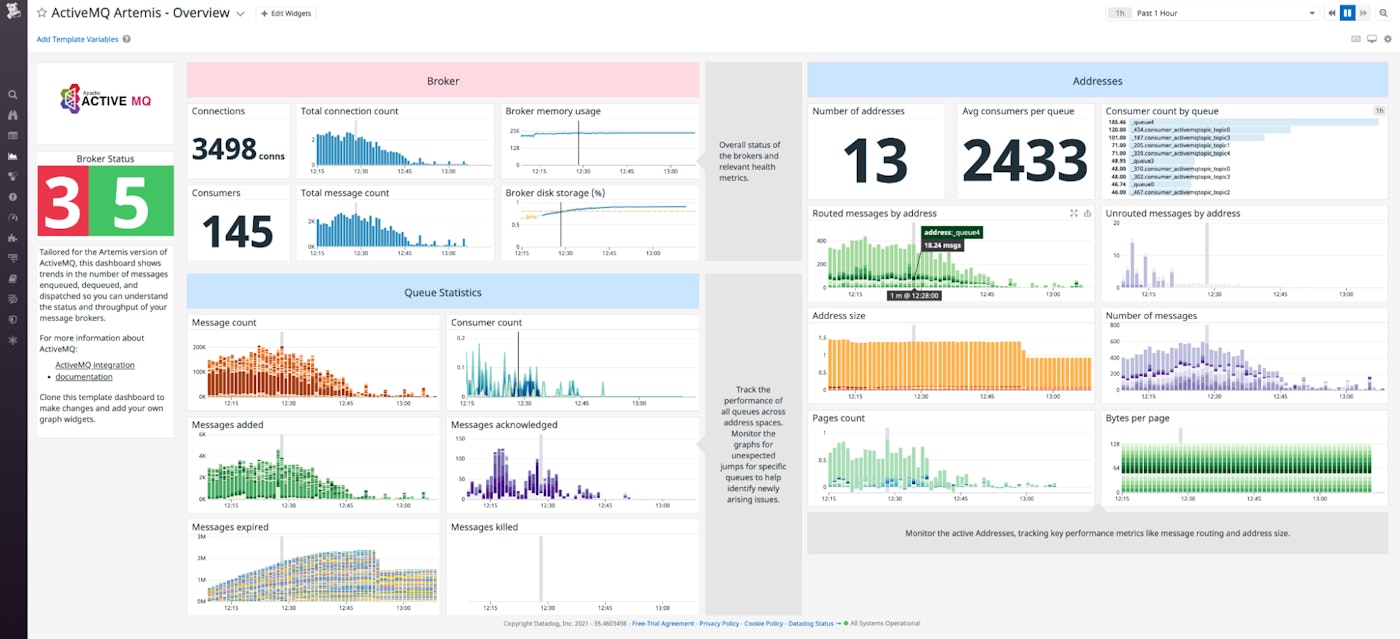
ActiveMQ runs inside the Java Virtual Machine (JVM), so it's important to also monitor the JVM's resources—as well as those of the host—to ensure that the broker, destinations, and addresses have sufficient resources. You can easily customize Datadog's built-in dashboard to include any host-level metrics and JVM metrics, as well as other application or infrastructure metrics that give you the visibility you need.
Tie ActiveMQ performance to memory usage
Monitoring memory usage metrics from your ActiveMQ broker and its destinations or addresses is critical for ensuring the health of your applications' messaging. If ActiveMQ runs low on memory, your producers may not be able to send messages.
The amount of memory available to a broker is determined by the broker's configuration and the resources on the host where it runs. Each destination or address consumes a portion of the broker's memory, and you can see the complete picture of ActiveMQ memory consumption by correlating the resource usage of the host with that of the ActiveMQ components.
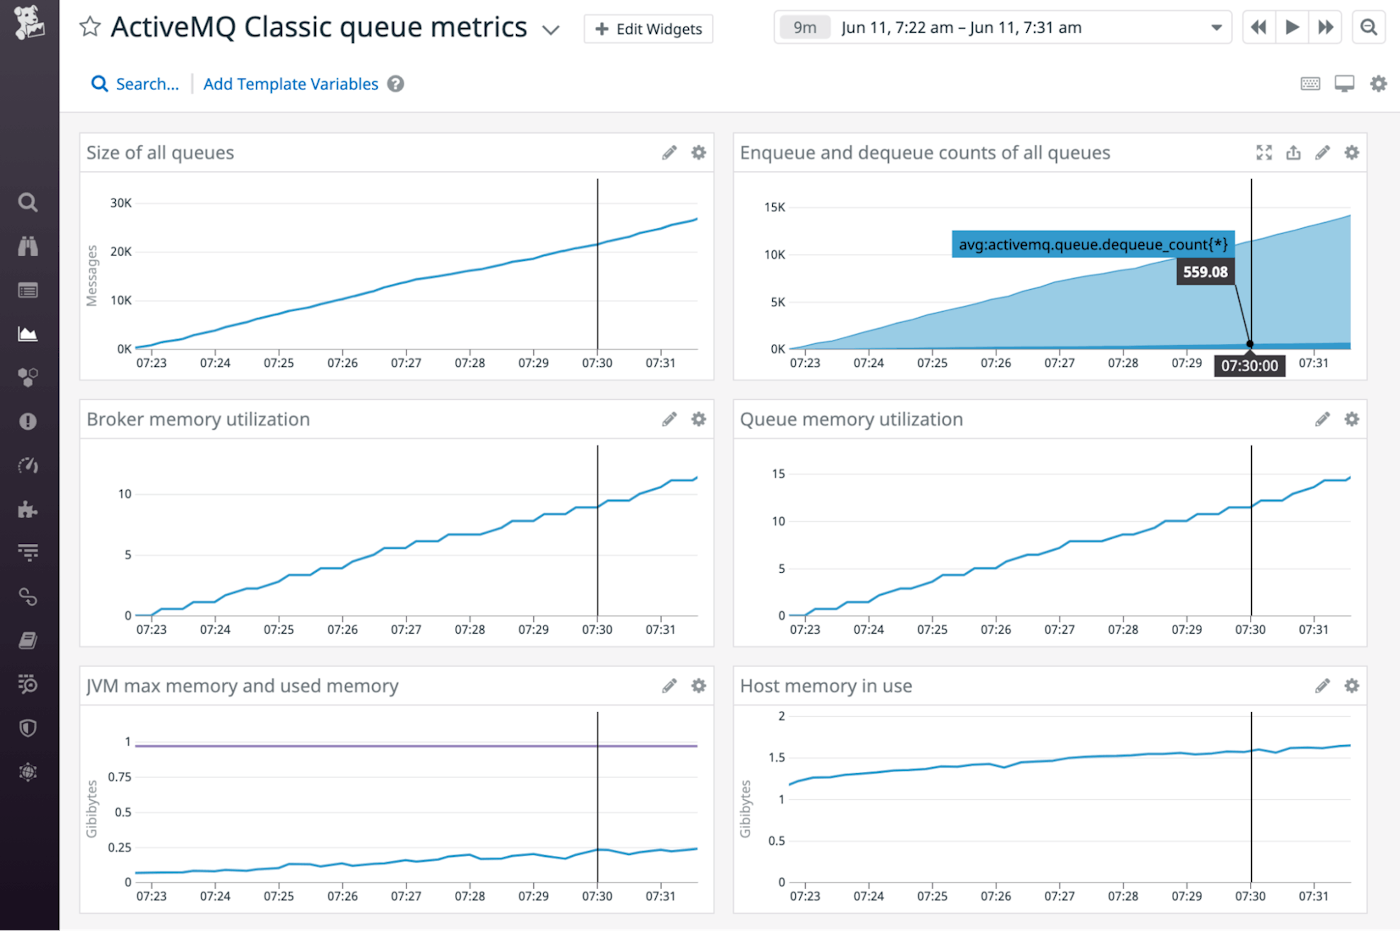
The graphs in the screenshot below correlate rising queue size in an ActiveMQ Classic broker with the increasing rate at which messages are enqueued and increasing memory utilization. The trends in these graphs suggest that as the queues continue to grow, the broker could run out of memory, slowing down any applications that rely on it.
Collect logs to learn more about ActiveMQ performance
ActiveMQ logs can provide the context and details you need to fully understand what you see on your dashboards. You can configure the Agent to automatically collect logs that give you details on ActiveMQ activity (such as when a broker starts or stops), resource constraints (such as when your broker tries to use more memory than your JVM has available), and reduced throughput (when Producer Flow Control (PFC) kicks in).
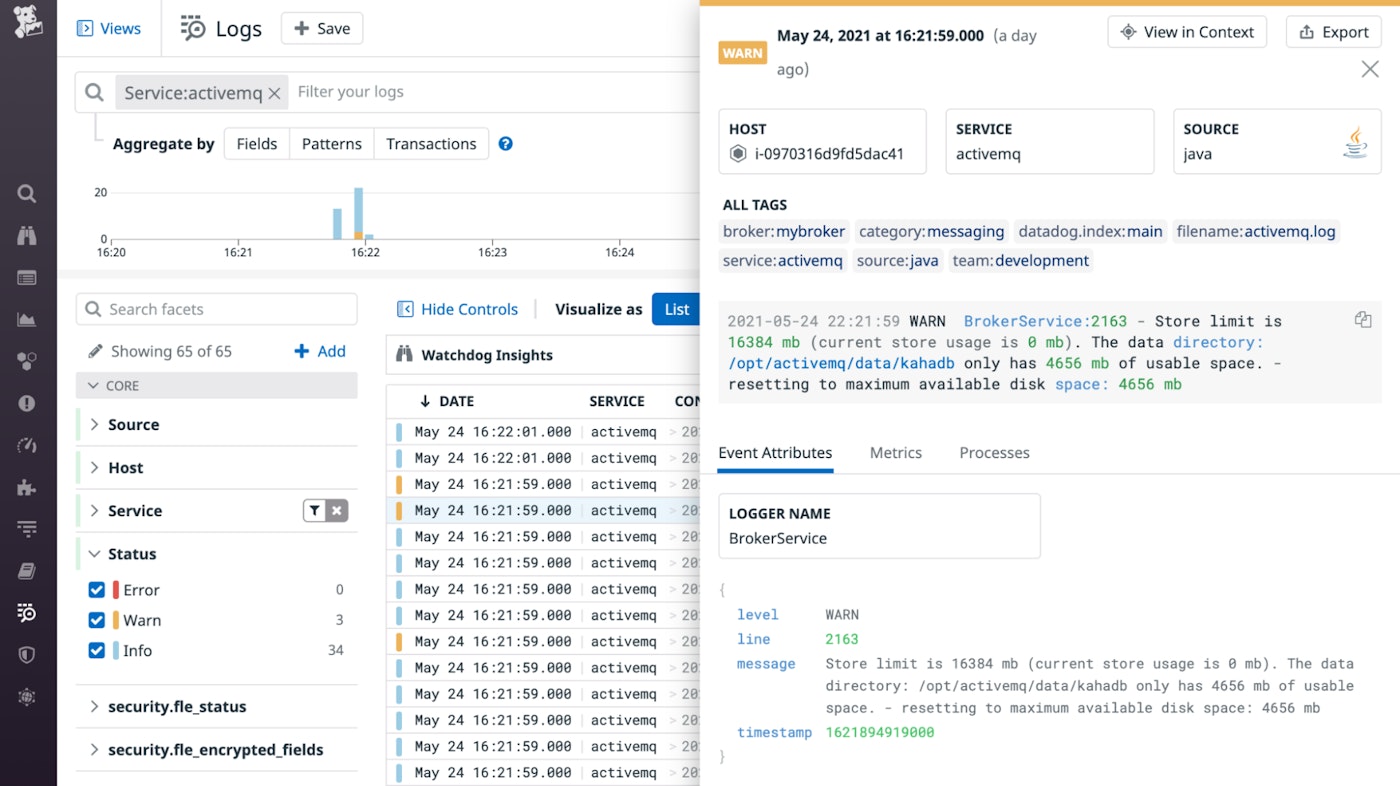
The log shown in the screenshot below explains that the broker's configuration specifies a store usage value that is greater than the amount of space available on the host, and that the limit has been automatically reset. Because this change could affect the performance of the broker, a log like this can provide critical insight into unexpected ActiveMQ behavior.
Use tags to correlate metrics, logs, and traces
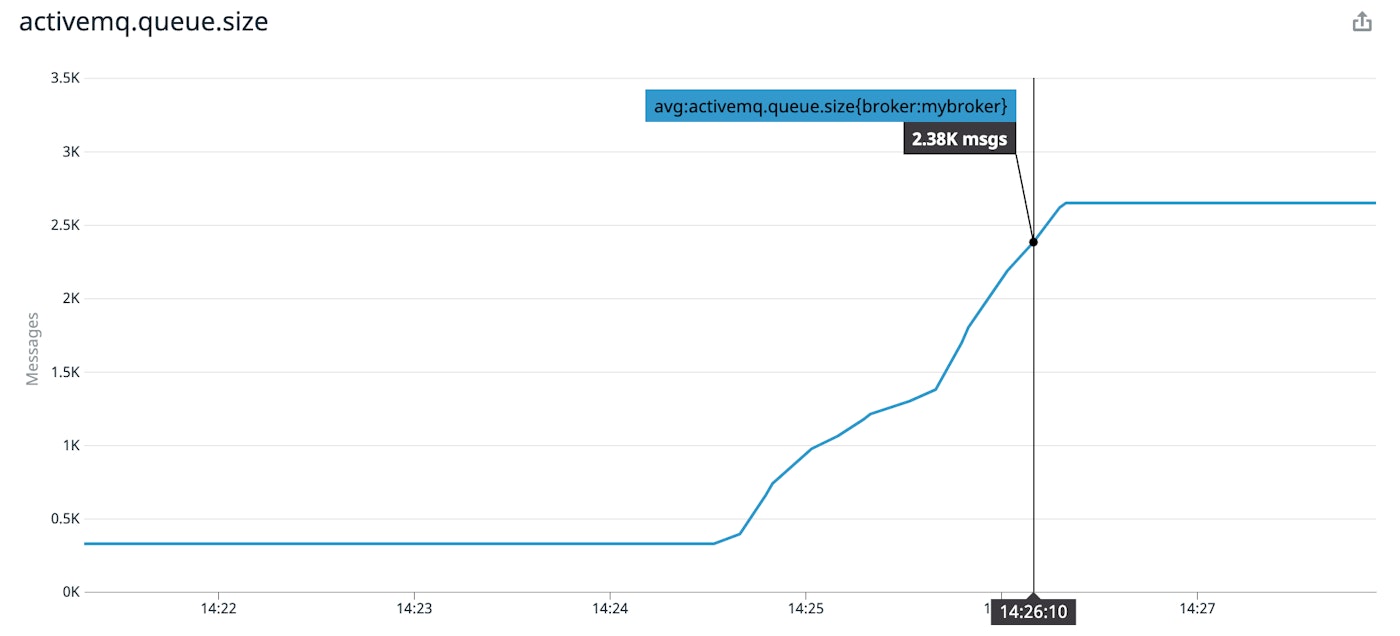
The Agent automatically applies tags that can help you understand the source and context of your ActiveMQ metrics. For example, activemq.queue.size includes tags that indicate the host, broker, and destination that generated the metric. These tags make it easy to visualize the performance of individual ActiveMQ components. The graph below shows a sharp increase in the number of messages queued on a specific broker (tagged mybroker), which could be due to a producer sending messages at an increased rate or a consumer that stopped processing messages.
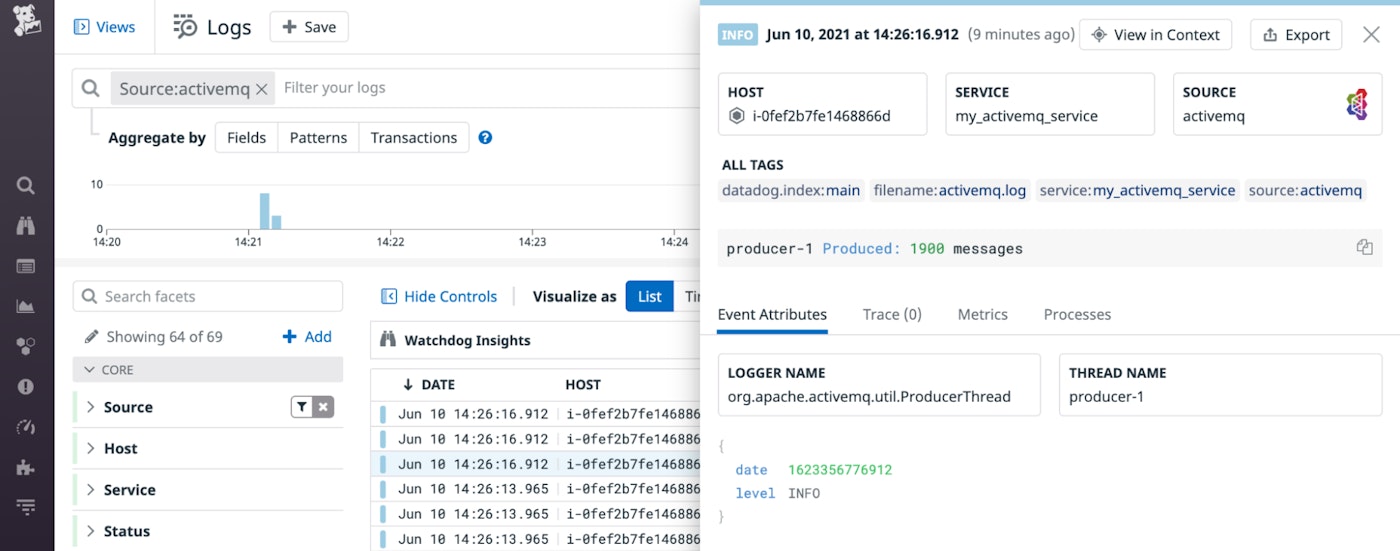
To troubleshoot, you can click the graph to pivot to ActiveMQ logs from the same time frame. In the screenshot below, the highlighted log identifies a single producer that sent a large batch of messages, allowing you to immediately focus your troubleshooting on a specific component of your messaging architecture.
You can also use a service tag to correlate metrics and logs from all of the ActiveMQ elements that make up a single application. Datadog APM gives you even greater visibility by tracing requests across your environment, allowing you to see the full picture of how ActiveMQ performance contributes to the overall health of your application.
Stay vigilant with ActiveMQ monitoring
Datadog makes it easy to monitor ActiveMQ Classic and ActiveMQ Artemis with a single integration that automatically collects data from all of your messaging components. If you're already a Datadog customer, see our blog post and setup documentation to start monitoring ActiveMQ. Otherwise, get started with a free 14-day trial.


