Network Observability: SD-WAN Reference Architecture
August 26, 2024
Introduction
Software-defined WAN (SD-WAN) is deployed by many enterprises to create a secure hybrid multi-cloud network fabric for connecting users, applications, and data across on-premises and cloud environments. Datadog SD-WAN network observability solution provides end-to-end visibility into the performance and health of SD-WAN infrastructure, enabling improved operational efficiency and informed decision-making.
Datadog provides the following SD-WAN observability capabilities:
- SD-WAN observability dashboard of the SD-WAN overlay and underlay network infrastructure
- Visualization of the SD-WAN infrastructure network path spanning on-premises, cloud, and multi-region cloud environments
- Visibility into the SD-WAN hub-and-spoke device metrics like interface/tunnel statistics, CPU usage, memory usage, reboots, disk usage, uptime, crash information, etc.
- Peering connection visibility between different SD-WAN controller services where applicable, such as Cisco vManage, vBond, vSmart, and vEdge.
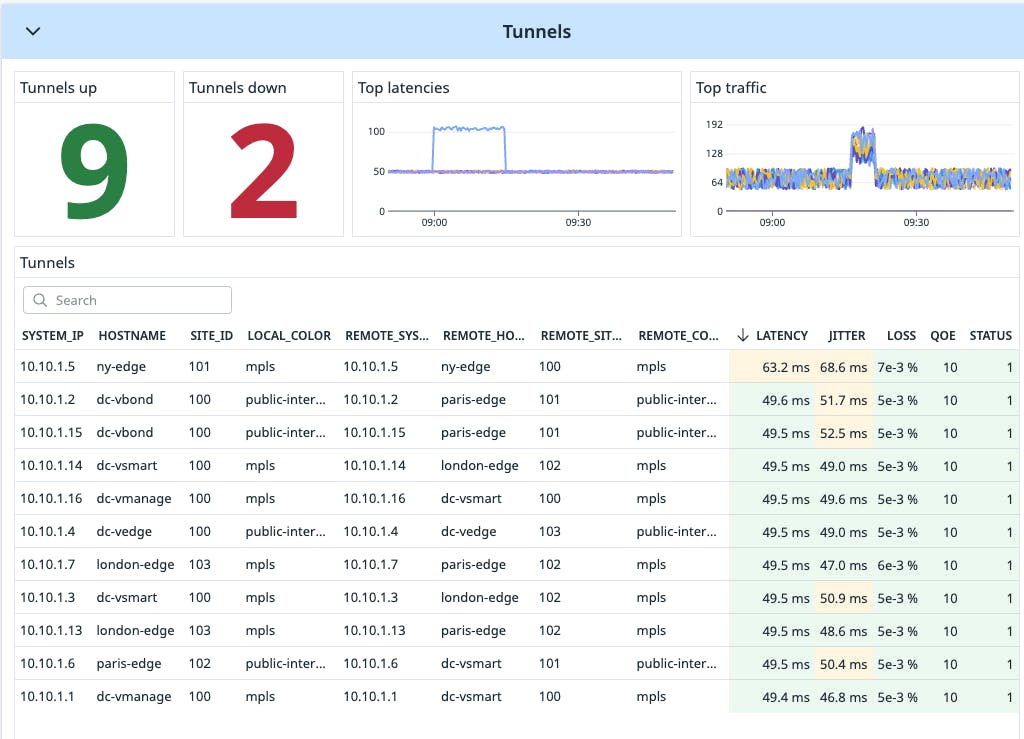
- Visibility into the performance of control plane and data plane tunnels, including latency, jitter, loss, and quality of experience information
- Rich user application routing over SD-WAN tunnels via NetFlow
Explanation of the architecture
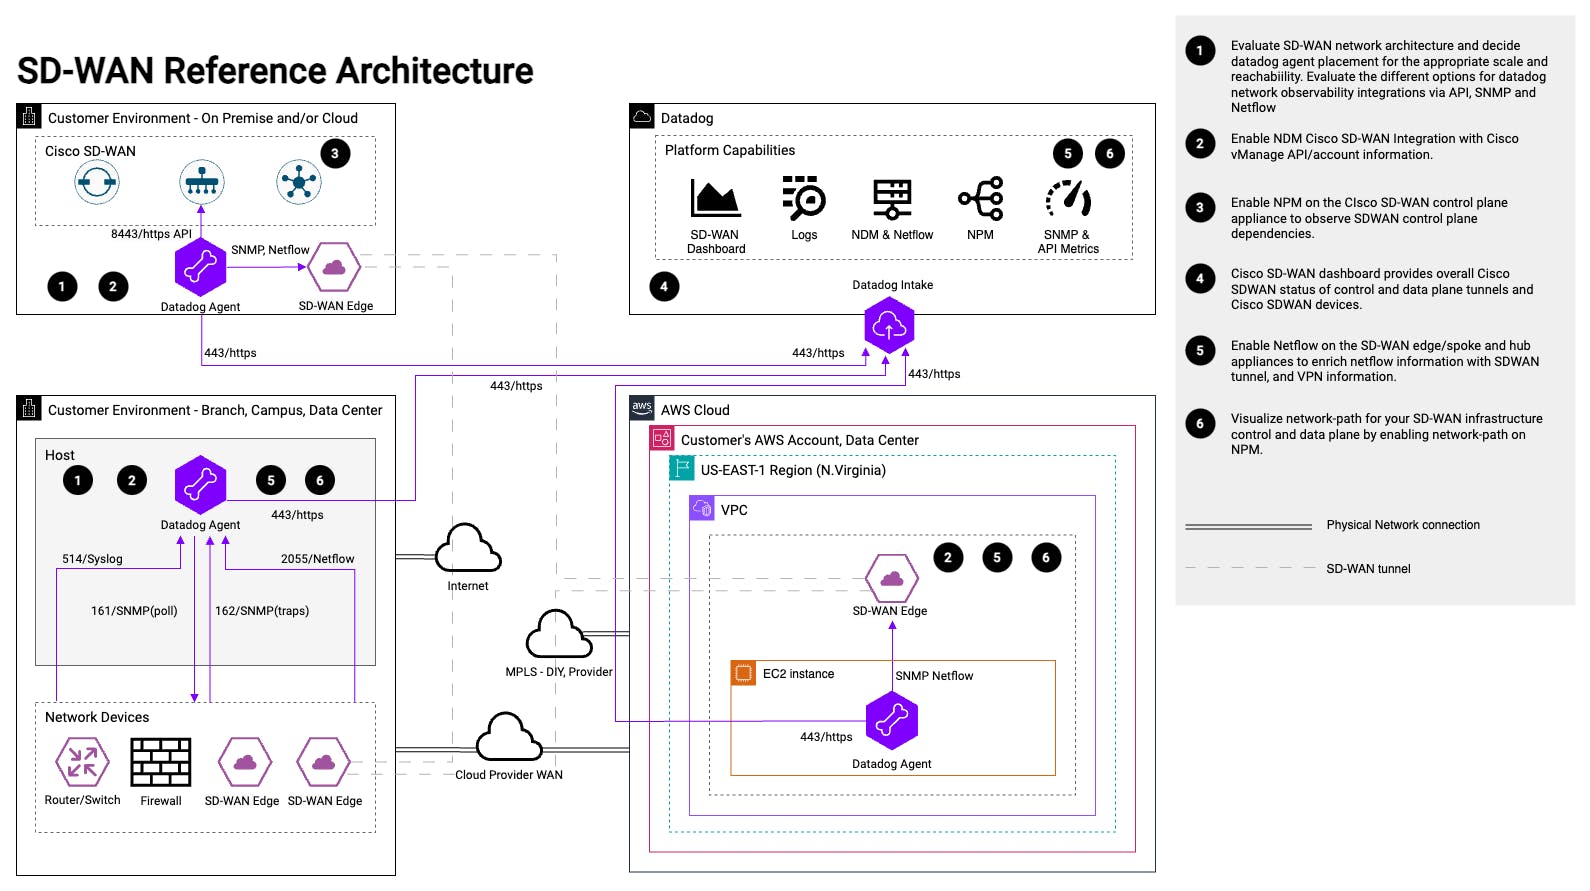
Datadog SD-WAN observability is a vendor-agnostic solution supporting hybrid multi-cloud SD-WAN infrastructure. Typical SD-WAN vendor implementations have control planes like Cisco vManage, vBond, and vSmart controllers deployed on-premises and/or in the cloud. The SD-WAN data plane devices are deployed at enterprise branch/campus/data center sites, co-location providers, and/or the public cloud. Datadog uses SNMP, NetFlow, CDP/LLDP, API, and eBPF technologies to connect with SD-WAN control plane hosts and SD-WAN data plane network devices to provide SD-WAN network observability. Datadog collects SD-WAN metrics, logs, and analytics for a unified dashboard in the Datadog SaaS cloud platform. The initial release of the SD-WAN observability solution will use SD-WAN vendor APIs to discover and provide observability of the SD-WAN infrastructure.
- Step 1: Design and Capacity Planning
Vendor SD-WAN controllers can be deployed on-premises, in a private cloud, or as a Network-as-a-Service (NaaS) solution. The SD-WAN edges can be deployed in different places in the overall network to enable a hybrid multi-cloud network fabric.
Deploying the Datadog Agent depends on the different capabilities that customers want to observe in their SD-WAN infrastructure. Customers can choose a centralized or distributed Datadog Agent deployment model. They can also combine the out-of-the-box SD-WAN API integration, NetFlow, SNMP, and eBPF integrations in one Agent or split the integrations across different Datadog Agents.
- Step 2: Datadog Agent with network device (NDM) configuration
Generic Datadog Network Device Monitoring installation can be found here and please refer to the NDM configuration for SD-WAN documentation. For the initial release of Datadog SD-WAN observability, vendor SD-WAN controller API is the mandatory integration option with the Datadog Agent. In future releases of Datadog, vendor SD-WAN routers that offer SNMP will provide further information to the Datadog Agent to enrich the overall SD-WAN network observability.
For the Cisco Catalyst SD-WAN integration with Datadog, here is the the sample YAML file location in the Agent:
datadog-agent/cmd/agent/dist/conf.d/cisco_sdwan.d/conf.yaml.example
Key considerations in the YAML configuration:- SD-WAN controller address: IP address or domain name for controller reachability
- SD-WAN controller login credentials like username/password
- Collection interval: Default 60 seconds. (Evaluate the performance impact on the SD-WAN controller)
- Step 3: Datadog Agent with network host (CNM) configuration
Generic Datadog Cloud Network Monitoring installation directions can be found here. Enabling CNM on the Datadog Agent provides deeper observability of the health and status of the SD-WAN control plane. In the Cisco SD-WAN solution, the SD-WAN control plane is comprised of vManage, vBond, and vSmart software services. Datadog Agent with CNM configuration can be installed on these control plane devices to visualize controller dependencies and communication between controllers for better troubleshooting of issues due to the SD-WAN controller.
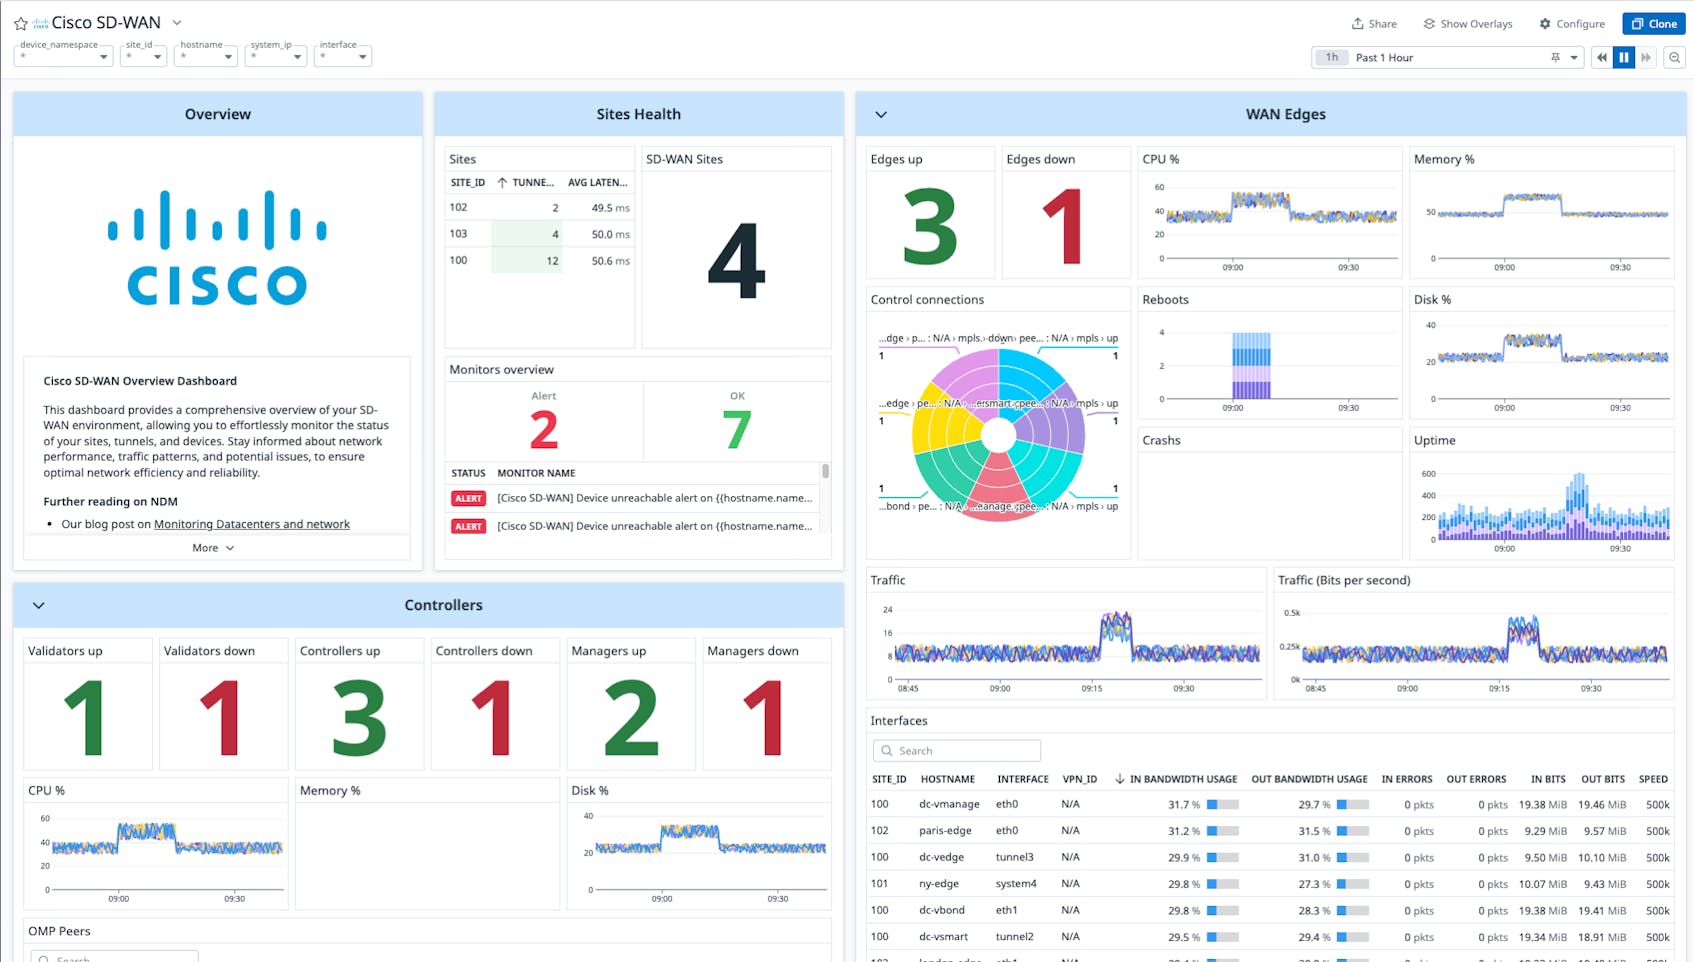
- Step 4: Out-of-the-box dashboard and metrics
After logging into Datadog, go to Infrastructure → Network Device Monitoring. Click on SD-WAN dashboard at the top right of the page to see a sample SD-WAN dashboard as shown below:
If you want to find more information, have a look at the Cisco SD-WAN integration.
- Step 5: NetFlow for SD-WAN
NetFlow monitoring for SD-WAN provides precise visibility into traffic flow from source to destination over an SD-WAN infrastructure. SD-WAN enhancements to NetFlow capabilities (depending on vendor support) provide additional SD-WAN tunnel, VPN, and application-specific insights of the flow. With Datadog NetFlow for SD-WAN integration, users can:
- Expand NetFlow capabilities to include application-level visibility, allowing administrators to see which applications are consuming bandwidth and how they are performing across the network.
- Visualize LAN to WAN traffic at SD-WAN edges.
- Enhance SD-WAN flow reporting to include more details like QOS markings, WAN interface, VPN IDs, and advanced performance metrics like jitter, roundtrip time, and application-specific performance data.
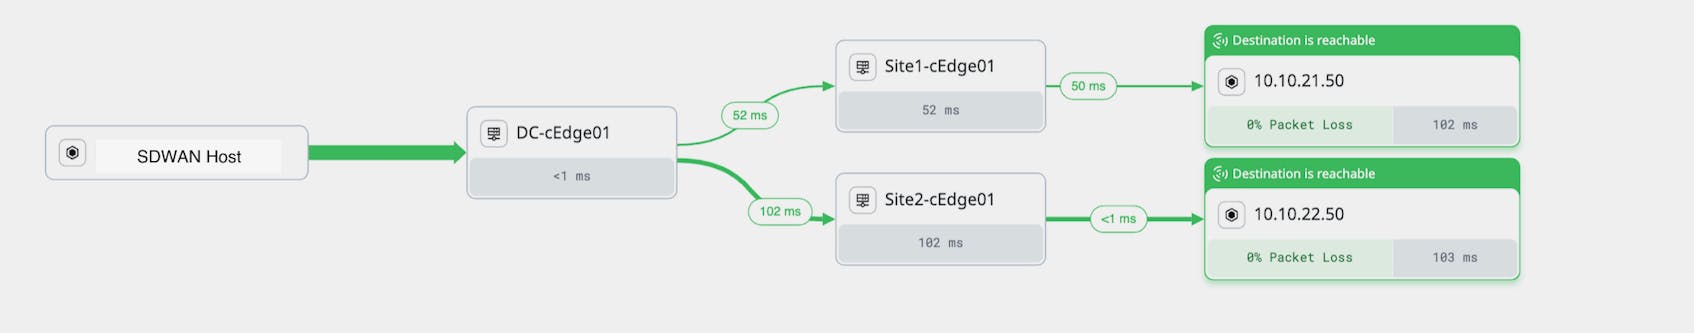
- Step 6: Network-path for SD-WAN
Enabling network path on the Datadog Agent in the SD-WAN infrastructure shows the path the network traffic follows from its origin to destination. With network path enabled on a hybrid multi-cloud infrastructure, you can gain insights into how user and application traffic traverses the SD-WAN infrastructure as shown in the picture below. If you want to know more, have look into the instructions to enable network path documentation.
Conclusion
Datadog SD-WAN observability lowers operational cost and management overhead while providing further insights into user experience and application performance of the SD-WAN network infrastructure.
Authors
Ripin Checker, Sr. Product Solutions Architect
References
Inspiration and reference documents or existing solutions: