Java Memory Usage | Datadog

Track and optimize Java memory usage

Monitor and analyze memory usage for your Java applications with Datadog.

Understanding the way your Java applications use, allocate, and manage memory can help minimize service disruptions and slow downs in end user experience. Datadog application performance tools like APM and the Continuous Profiler allow you to analyze and optimize Java memory usage in a single unified platform.


Seamlessly monitor and analyze Java memory usage

Use fully integrated performance views to keep Java applications running smoothly.
  • Alert on memory usage errors to understand if you need to manually allocate or release memory
  • Investigate JVM runtime metrics and garbage collection logs to identify and remedy memory issues quickly
  • Visualize and correlate key Java memory usage metrics alongside performance data from the rest of your stack

Optimize Java performance with Datadog APM

Correlate end-to-end distributed traces with full stack telemetry to fine tune Java memory usage.
  • Track and compare Java memory usage and other performance indicators during code deployments and over time
  • Trace and break down Java requests to identify bottlenecks and errors across your distributed systems
  • Inspect methods, classes, and threads for requests tied to Java memory usage data with the Continuous Profiler

Track Java memory usage with the Continuous Profiler

Continuously profile each line of your Java code without impacting application performance and user experience.
  • Automatically surface Java memory usage issues like inefficient garbage collection or memory leaks
  • Determine the root cause of slow requests with a breakdown of time spent by method on garbage collection, synchronization, and I/O
  • Easily aggregate memory usage profiles across hosts, services, and code versions

Next-generation Java memory usage monitoring

Track and analyze Java application performance in context.
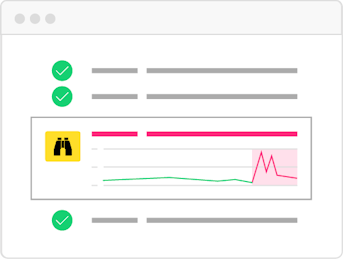
watchdog-apm-illustration.png

Watchdog

Auto-detect Java performance issues without manual alert configuration.
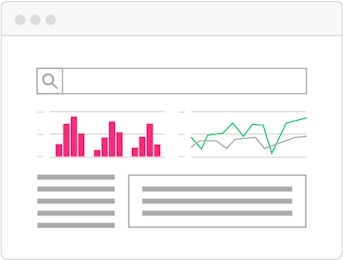
tracesearch-apm-illustrationv2.png

App Analytics

Find, filter, and analyze Java stack traces with a few clicks.
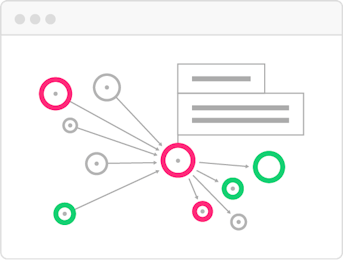
servicemap-apm-illustration.png

Service Map

Monitor Java application interdependencies in real time.

Loved & Trusted by Thousands

Washington Post logo 21st Century Fox Home Entertainment logo Peloton logo Samsung logo Comcast logo Nginx logo